US stock market crash: December cycle prediction plays out as Nasdaq, S&P 500, Dow Jones bleed

Nasdaq plunges 20%, S&P 500 and Dow Jones tumble as Trump's tariffs spark full-scale correction—historical patterns signal deeper losses ahead
The writing was on the wall, as clearly outlined in our December 2024 analysis titled "Is the US stock market bull run running out of steam? Historical patterns signal possible endgame." At that point, our analysis warned investors that major US indices—the Nasdaq 100, S&P 500, and Dow Jones—were nearing critical inflection points after a relentless bull market run. The Nasdaq 100 peaked around 22010, the S&P 500 at 6020, and the Dow Jones at approximately 45050.
Fast-forward to April 2025, and the predictions are manifesting before our eyes. Structural weaknesses first observed in February 2025 have now deepened into a major market downturn, exacerbated by geopolitical turmoil from the "Trump Liberation Day" tariffs. These tariffs have not only unsettled global trade but also acted as the final catalyst triggering panic-selling across equity markets.
Nasdaq 100 enters bear market territory
The Nasdaq 100, typically sensitive to shifts in risk sentiment, has now fallen dramatically into a textbook bear market, declining 20% from its all-time high. At the time of writing, the index trades near the critical support at 17285, marking the second stage of the anticipated major pullback. The selling intensified sharply in the past two trading sessions, shedding more than 5% amid intensifying fears of prolonged trade tensions.
Technical analysis indicates that if Nasdaq loses the immediate support level at 17444, it opens the door for further declines toward 16836. Any short-term recovery attempts face significant resistance around 18205 and then again at the critical pivot near 18440.
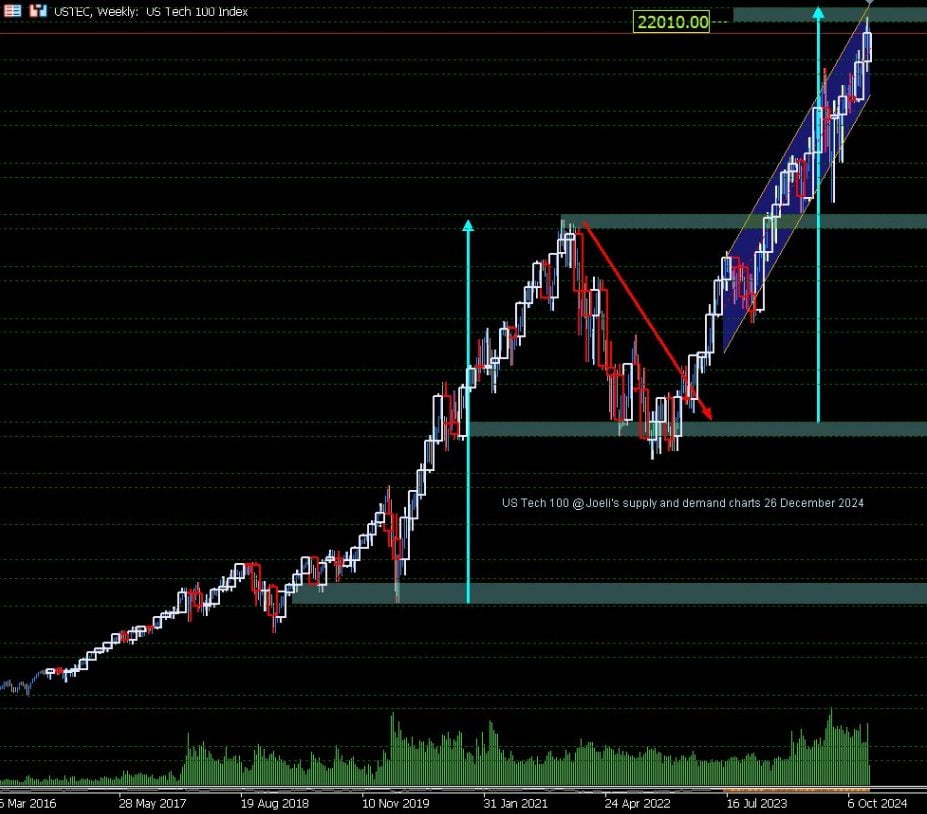
Nasdaq 100 December 2024 analysis
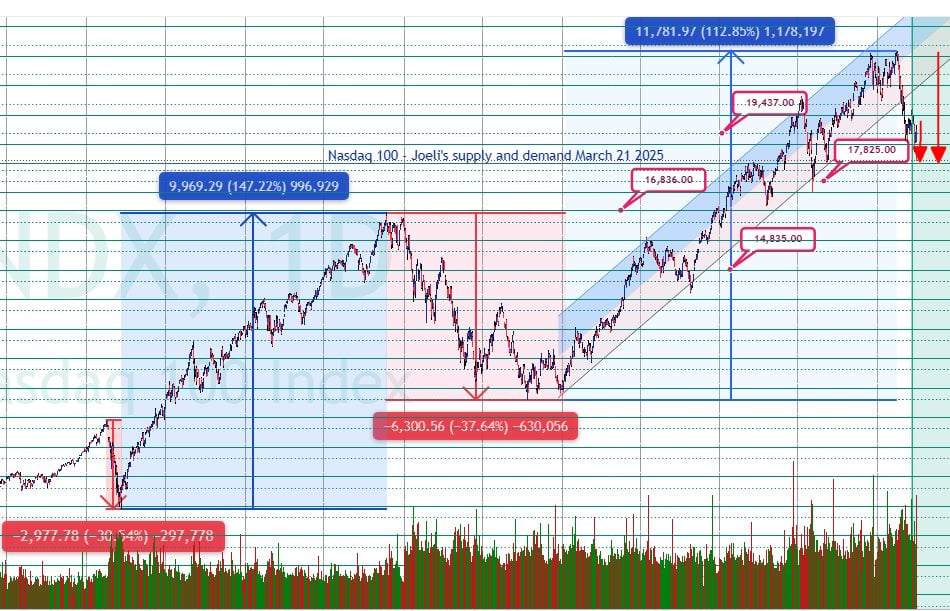
Nasdaq 100 April 4th 2025 analysis
S&P 500 deepens correction, critical levels approaching
The S&P 500 (SPX) has mirrored the Nasdaq's weakness, suffering severe losses and declining over 16% from its record highs. In the last two days alone, SPX dropped 6%, underscoring market panic. Currently, the index is testing a significant technical zone at 5151—the second stage of its corrective cycle identified in December's analysis.
If selling pressure persists below 5151, investors could see accelerated declines toward subsequent support levels at 5030 and 4955. A potential third stage of this major market correction would likely drive prices even lower, targeting the crucial support level at 4834. Any upside recovery would encounter significant resistance at 5225 and 5300, limiting the chances of a sustained rebound in the near term.
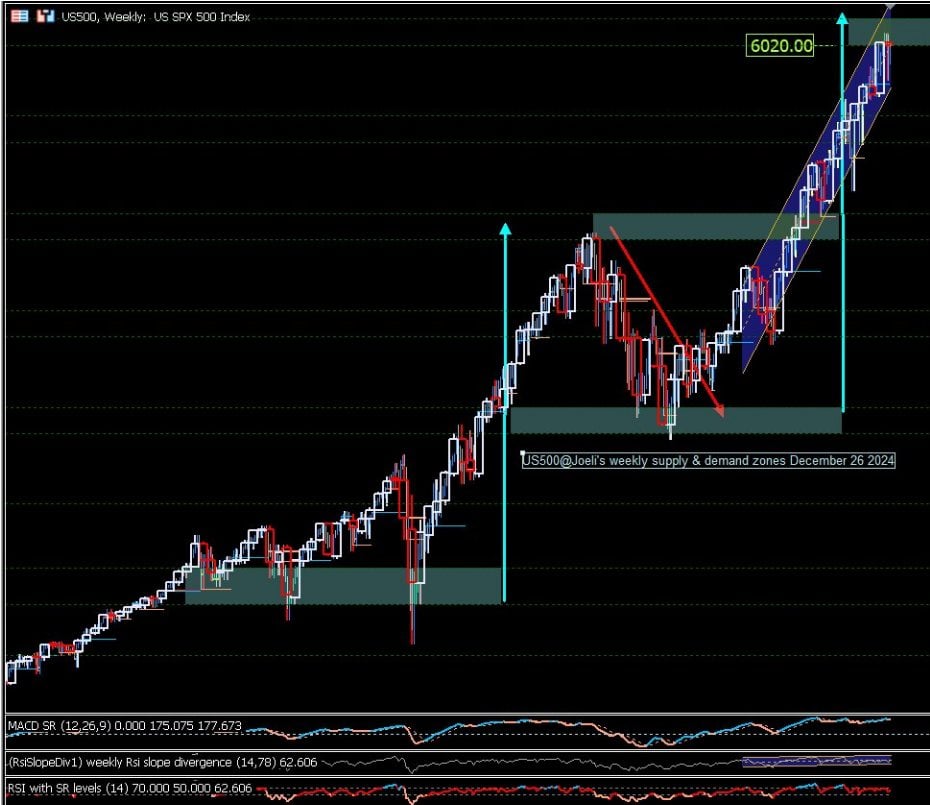
US 500 December 2024 analysis
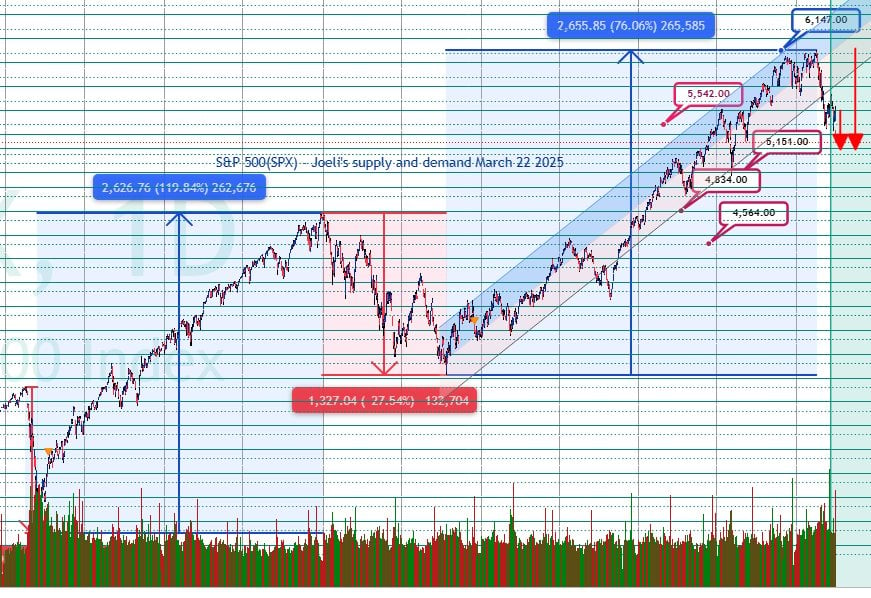
US 500 April 4th 2025 analysis
Dow Jones faces China's retaliation
The Dow Jones Industrial Average (DJIA), previously considered a haven for stability, is also bleeding heavily. The DJIA has dropped by approximately 1450 points over two sessions, marking a decline of over 14% from its historical highs. China's swift retaliatory tariffs against Trump's policies further intensified selling pressure, driving the Dow Jones sharply lower.
Currently trading at the critical second-stage support of 38982, further downside looks increasingly likely. Should the index fail to hold this level, subsequent support levels are found at 38508 and, notably, 37743. A deeper third-stage correction scenario outlined in our December analysis targets the critical psychological and technical support at 36504. Any bullish reversal attempt faces substantial resistance at 39747 and, more significantly, at 40230.
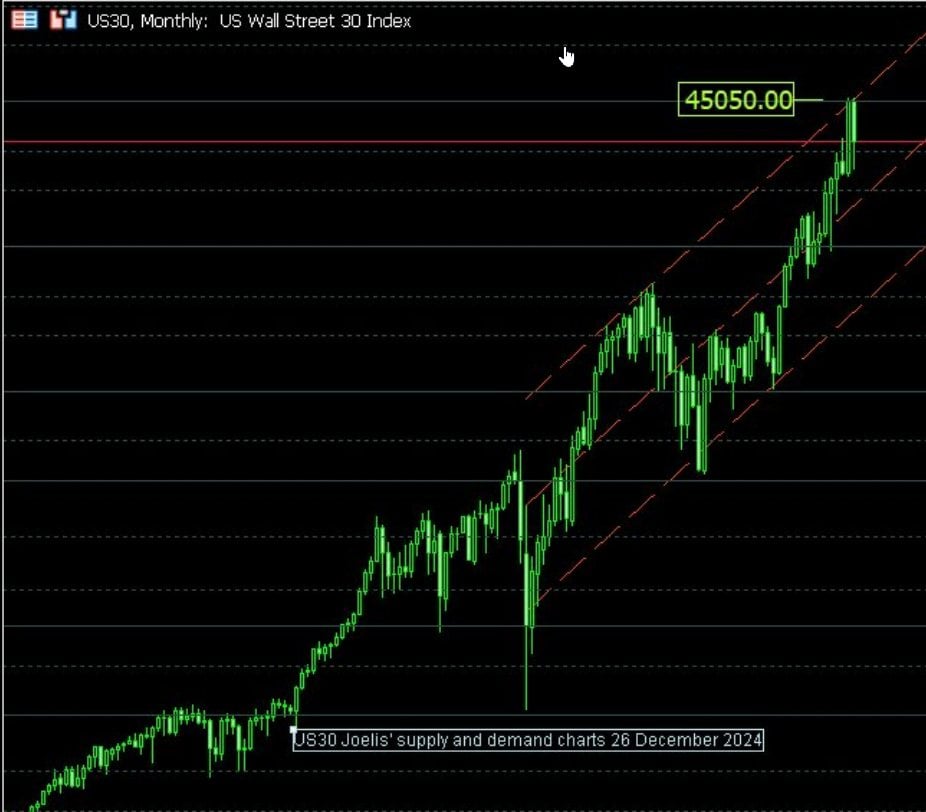
Dow Jones December 2024 analysis
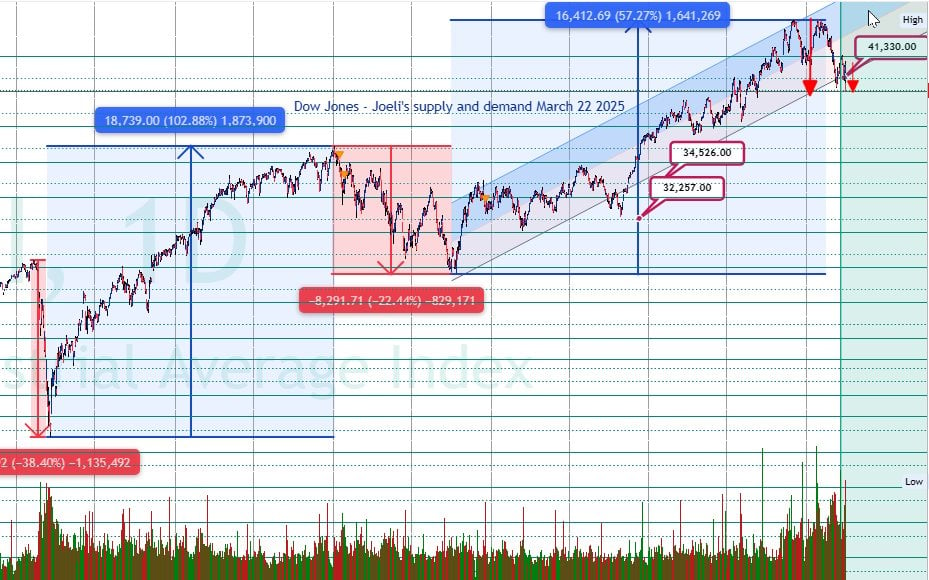
Dow Jones April 4th 2025 analysis
Fundamental catalysts fueling the sell-off
The recent sell-off has not only been a technical phenomenon but also reflects significant fundamental shifts:
- Trump Liberation Day tariffs: These protectionist policies, initially targeting Canada and Mexico, have expanded into a broader trade war with China, severely disrupting global trade dynamics and investor confidence.
- Deteriorating economic outlook: Rising geopolitical tensions combined with higher inflation and interest rate pressures from the Federal Reserve have further deteriorated sentiment.
- Corporate earnings concerns: With tariffs affecting supply chains and profitability, investors now anticipate weaker corporate earnings guidance, adding fuel to market declines.
Historical patterns offer clues for what's next
Historical patterns, as extensively detailed in our December 2024 analysis, suggest that the selling typically accelerates once markets enter this correction phase before reaching a sustainable bottom. Investors should brace for heightened volatility and more downside risks until clearer signs of stabilization emerge, potentially over the coming months or even a year.
Conclusion and investor takeaways
The ongoing market turmoil is a timely reminder of the predictive power of historical cycles and comprehensive technical analysis. Investors should exercise caution and remain vigilant of critical levels highlighted in this analysis. While short-term rebounds may occur, the broader trend clearly points toward sustained bearish pressure.
As markets navigate these turbulent waters, prudently managed portfolios, careful risk management, and close monitoring of technical and fundamental indicators will be crucial. I will continue to provide timely updates to guide investors through these unprecedented market developments.
Author

Denis Joeli Fatiaki
Independent Analyst
Denis Joeli Fatiaki possesses over a decade of extensive experience as a multi-asset trader and Market Strategist.


