Gold Price Forecast: XAU/USD rebounds ahead of key US data, will it last?
- Gold price stages a decent bounce toward $2,340 early Wednesday amid a better mood.
- The US Dollar stabilizes with US Treasury bond yields, in the aftermath of weak US JOLTS data.
- Gold price yielded a range breakdown below the 50-day SMA on Tuesday while the RSI turned bearish.

Gold price is attempting a tepid rebound toward $2,340 early Wednesday, having tested the three-week low of $2,315 a day ago. Attention turns toward the top-tier US ADP jobs and ISM Services PMI data for fresh cues on the US Federal Reserve (Fed) interest rate outlook, which will likely significantly impact the non-interest-bearing Gold price.
Gold price awaits more high-impact US data
Gold price finds its feet in Asian trading on Wednesday, as the US Dollar loses its recovery momentum, as risk sentiment improves after upbeat China’s Caixin Services PMI data. China’s S&P Global Caixin Services PMI jumped to 54.0 in May from a 52.5 figure seen in April, beating the market forecast of 52.6.
Encouraging China’s manufacturing and services activity data points to improving economic performance in the world’s top Gold consumer. Additionally, Gold buyers stay hopeful ahead of the ADP private sector Employment Change data and the ISM Services PMI, especially after the recent couple of soft US economic releases revived expectations for a September Fed rate cut.
Job openings, a measure of labor demand, were down 296,000 to 8.059 million on the last day of April, the lowest level since February 2021, the Labor Department's Bureau of Labor Statistics (BLS) said on Tuesday in its JOLTS survey.
Data released by the ISM showed on Monday, the Manufacturing PMI index dropped from 49.2 in April to 48.7 in May, missing the expected 49.6 print. The ISM Manufacturing Prices Paid eased to 57.0 in May vs. 60.9 previous and 60.0 expected.
Markets are currently pricing in about a 56% chance of a 25 basis points (bps) Fed rate cut in September, against a 52% probability of such a reduction seen Monday, CME Group’s FedWatch tool shows.
Renewed dovish Fed expectations could continue to undermine the US Dollar and revive the bullish sentiment around Gold price should the US ADP jobs and ISM Services PMI data disappoint markets later on Wednesday.
Gold price technical analysis: Daily chart
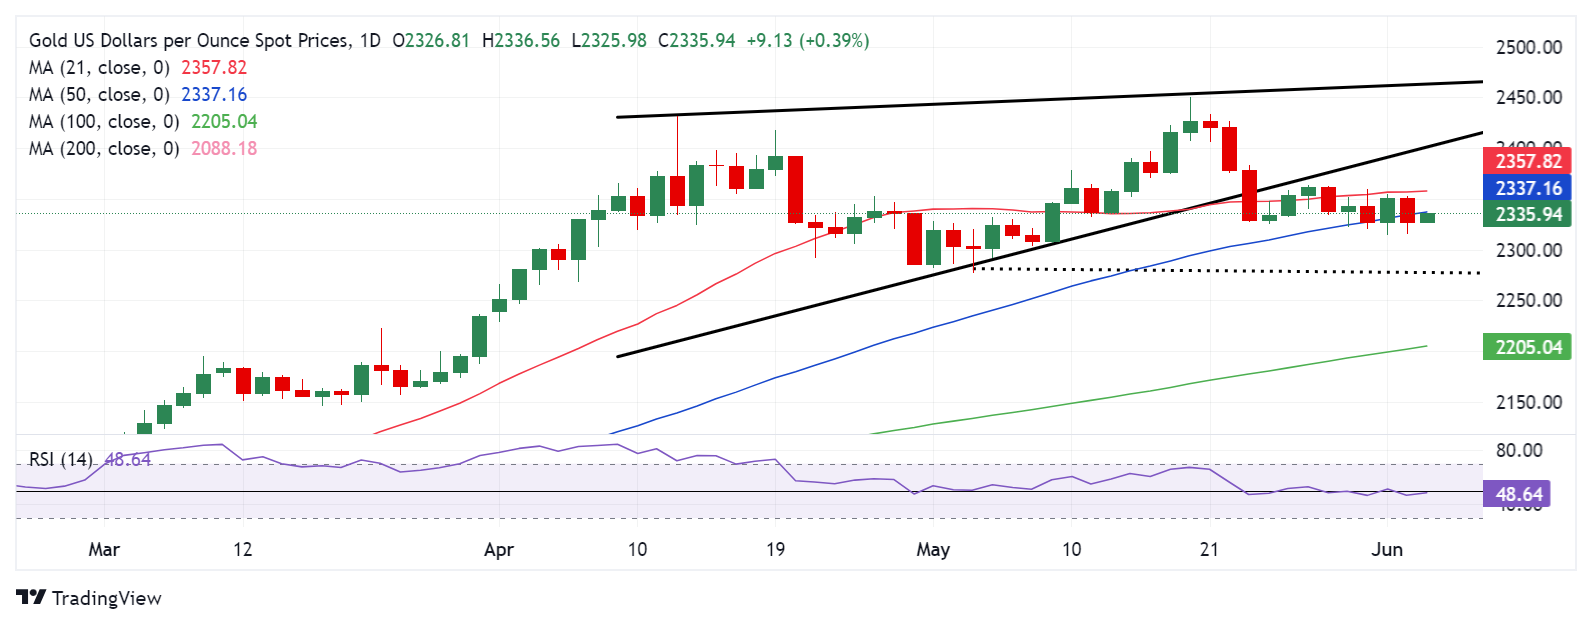
As observed on the daily chart, the Gold price yielded a range breakout by closing Tuesday beneath the key 50-day Simple Moving Average (SMA) support, which was then at $2,335.
The 14-day Relative Strength Index (RSI) has returned to negative territory below the 50 level, justifying the downside break.
Gold sellers need a sustained move below the three-week low of $2,315 to extend the downtrend toward the $2,300 level.
Further south, a drop toward the May 3 low of $2,277 will be on the cards.
Alternatively, any recovery in Gold price will need acceptance above the 50-day SMA support-turned-resistance, now at $2,337 to take on the stiff 21-day SMA at $2,358.
Further up, Gold buyers could flex their muscles toward the May 24 high of $2,364, above which Gold price could see a run toward the rising wedge support-turned-resistance at $2,400.
Gold FAQs
Gold has played a key role in human’s history as it has been widely used as a store of value and medium of exchange. Currently, apart from its shine and usage for jewelry, the precious metal is widely seen as a safe-haven asset, meaning that it is considered a good investment during turbulent times. Gold is also widely seen as a hedge against inflation and against depreciating currencies as it doesn’t rely on any specific issuer or government.
Central banks are the biggest Gold holders. In their aim to support their currencies in turbulent times, central banks tend to diversify their reserves and buy Gold to improve the perceived strength of the economy and the currency. High Gold reserves can be a source of trust for a country’s solvency. Central banks added 1,136 tonnes of Gold worth around $70 billion to their reserves in 2022, according to data from the World Gold Council. This is the highest yearly purchase since records began. Central banks from emerging economies such as China, India and Turkey are quickly increasing their Gold reserves.
Gold has an inverse correlation with the US Dollar and US Treasuries, which are both major reserve and safe-haven assets. When the Dollar depreciates, Gold tends to rise, enabling investors and central banks to diversify their assets in turbulent times. Gold is also inversely correlated with risk assets. A rally in the stock market tends to weaken Gold price, while sell-offs in riskier markets tend to favor the precious metal.
The price can move due to a wide range of factors. Geopolitical instability or fears of a deep recession can quickly make Gold price escalate due to its safe-haven status. As a yield-less asset, Gold tends to rise with lower interest rates, while higher cost of money usually weighs down on the yellow metal. Still, most moves depend on how the US Dollar (USD) behaves as the asset is priced in dollars (XAU/USD). A strong Dollar tends to keep the price of Gold controlled, whereas a weaker Dollar is likely to push Gold prices up.
Author

Dhwani Mehta
FXStreet
Residing in Mumbai (India), Dhwani is a Senior Analyst and Manager of the Asian session at FXStreet. She has over 10 years of experience in analyzing and covering the global financial markets, with specialization in Forex and commodities markets.