Will Brent Oil recover? – Trade tensions and inventory data to watch
-
Brent oil prices are volatile due to concerns about US tariffs, potential global recession, and OPEC+ supply decisions.
-
Technical analysis suggests a possible recovery for Brent crude, with the RSI indicating a potential shift in momentum.
-
US drilling activity could slow down if WTI prices remain below $65 per barrel, potentially impacting supply.

Brent crude prices were up around 1% in the Asian session but have since turned red for the day following the European open.
Oil prices recovered from their lowest point in nearly four years during the Asian session as worries persist that U.S. tariffs could hurt demand and trigger a global recession. Caution remains as there are still risks of further declines in the days ahead.
As of Monday, Brent and WTI had slumped 14% and 15% respectively following U.S. President Donald Trump's April 2 announcement of "reciprocal tariffs" on all imports.
The situation remains risky as President Trump threatened to add a 50% tariff on Chinese goods if China doesn’t remove its 34% retaliatory tariff yesterday. It’s unlikely China will change its stance with comments overnight hinting as much, which means tensions could rise further, adding to concerns about slower growth and weaker oil demand.
OPEC + concerns
Crude oil prices dropping since April 2 suggest the market sees a higher chance of a recession. The sharp decline will likely concern OPEC+, which surprised everyone last week by announcing a bigger supply increase for May.
If prices keep falling, OPEC+ might stop or even reverse these increases. Saudi Arabia needs around $90 per barrel to balance its budget according to ING. While last week’s supply hike shows they’re not targeting this price, they likely don’t want to see oil prices drop much further below their breakeven point.
A Reuters report yesterday revealed OPEC's oil production dropped in March before a planned output increase, according to a Reuters survey. Nigeria reduced supplies to local refineries, and U.S. efforts to cut exports from Iran and Venezuela had an impact. OPEC produced 26.63 million barrels per day last month, 110,000 barrels per day less than in February, with the biggest declines from Nigeria, Iran, and Venezuela.
Is there a Silver lining for Oil producers?
Market participants looking at the supply and demand picture may have a small reason to be optimistic. As with OPEC +, if Oil prices drop too far the profitability comes into question which could help lessen supply and provide some support to prices.
For example, a slowdown in U.S. drilling could give the market some support. There is a case to be made that with current WTI prices a drop in drilling activity becomes a real possibility. This could eventually lead to slower supply growth or even a drop in U.S. oil production. U.S. shale production declines quickly, so constant drilling is needed to maintain stable output. According to the Dallas Federal Reserve Energy survey, producers need about $65 per barrel to profitably drill a new well.
The longer WTI prices hover below the $65 a barrel, the greater the probability that drilling activity may start to be impacted. This is definitely worth monitoring.
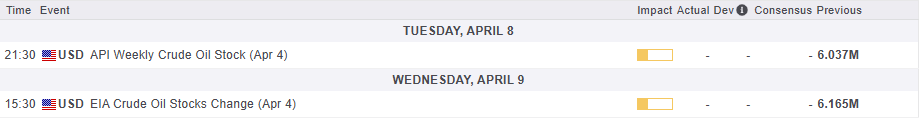
Inventories data due later this week
A preliminary Reuters poll on Monday suggested that U.S. crude oil and distillate stockpiles likely increased by about 1.6 million barrels last week, pointing to weak demand. The American Petroleum Institute is set to release inventory data on Tuesday, with official numbers from the Energy Information Administration coming on Wednesday.
Technical analysis - Brent Crude
This is a follow-up analysis of my prior report “Brent Oil price plummets: OPEC+ output hike & price outlook” published on April 1 2025.
From a technical analysis standpoint, Brent has printed an indecision doji candle on the daily timeframe which could hint at a potentisla recovery.
The period 14-RSI is in overbought territory and may be used as a confirmation of sorts that momentum has shifted. When the RSI crosses back above the 30 level this could be a sign.
Immediate resistance rests at 66.42 and 68.17 before the 69.52 and 70.00 psychological handle come into focus.
Having broken above the descending trendline Brent looked poised for further gain earlier this week. However, as discussed in the article on April 1, the fundamentals did not support the technicals completely. Downside risk was always present with growth concerns always likely to arise from the tariff announcements.
A move lower from current price and yesterday's lows are the first area of support resting at 62.76 before the 61.00 and psychological 60.oo handle comes into focus.
For now though, Oil will be driven by overall market sentiment as well as developments around the tariff picture moving forward.
Brent Crude Oil daily chart, April 8, 2025
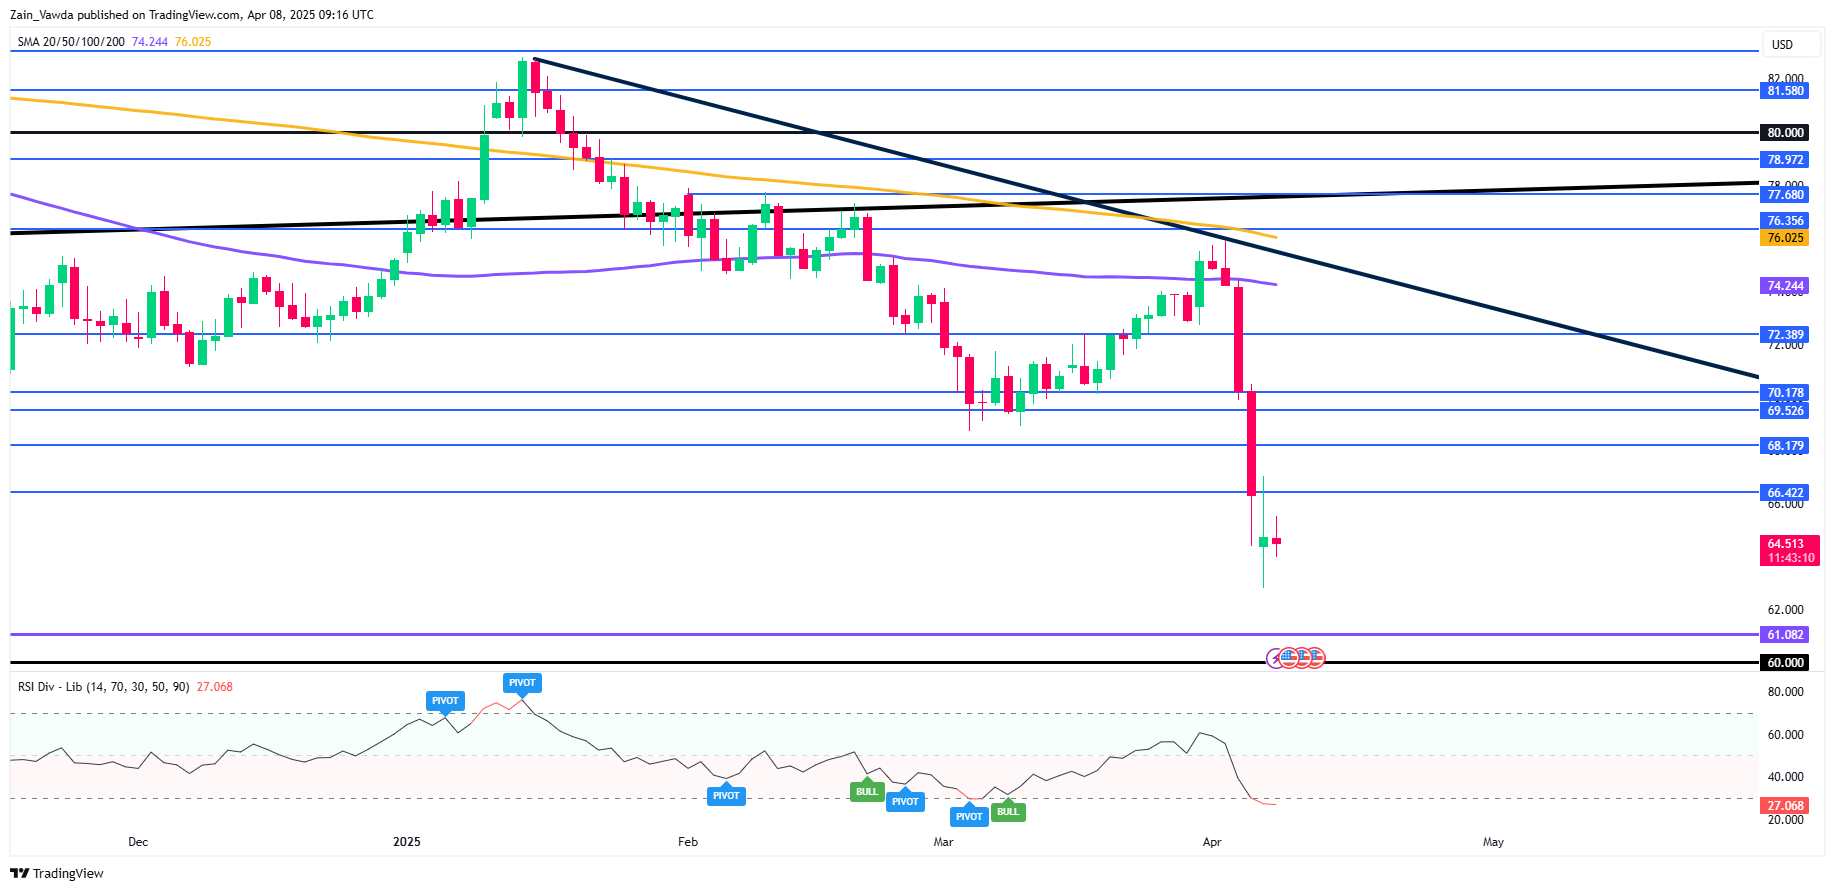
Source: TradingView (click to enlarge)
Support
-
62.76.
-
61.00.
-
60.00 (psychological level).
Resistance
-
66.42.
-
68.17.
-
69.52.
Client sentiment data
Looking at OANDA client sentiment data and market participants are long on WTI with 91% of traders holding long positions. I prefer to take a contrarian view toward crowd sentiment and thus the fact that so many traders are long means WTI prices could decline further.
Author

Zain Vawda
MarketPulse
Zain is a seasoned financial markets analyst and educator with expertise in retail forex, economics, and market analysis.


