Gold Price Forecast: XAU/USD nears $2,700 as Fed’s announcement looms

XAU/USD Current price: $2,694.73
- The US Federal Reserve is expected to cut the main interest rate by 25 basis points.
- The US Dollar eases ahead of the announcement, yet the slide remains corrective.
- XAU/USD trimmed half of Wednesday’s losses, the bullish potential remains limited.
Spot Gold rallied after Wall Street’s opening, nearing the $2,700 mark after trading as low as $2,643.28 early in the Asian session. The US Dollar lost steam on persistent stocks’ strength following the United States (US) presidential election result. Most Asian and European indexes closed in the green, in line with renewed risk appetite, which finally took its toll on the USD.
US indexes trade mixed, with the S&P500 extending its recent rally to unexplored territory, but the Dow Jones Industrial Average (DJIA) was barely capable of holding ground. Market participants await the Federal Reserve (Fed) monetary policy announcement. The Fed is expected to trim the interest rate by 25 basis points (bps), a movement that was priced long ago.
Market players, however, will focus on how the Fed will respond to the latest political developments in the US. Trump’s victory is seen as a steep turnaround that could interrupt the recently adopted monetary loosening path. Chairman Jerome Powell has multiple times remarked on the central bank’s independence from the government and will likely repeat so in his post-decision speech.
Nevertheless, neither Powell nor investors could ignore the fact that Trump’s ideas alongside the Republican platform may bring back to the table mounting inflationary pressures. In such a scenario, Gold is likely to strengthen.
XAU/USD short-term technical outlook
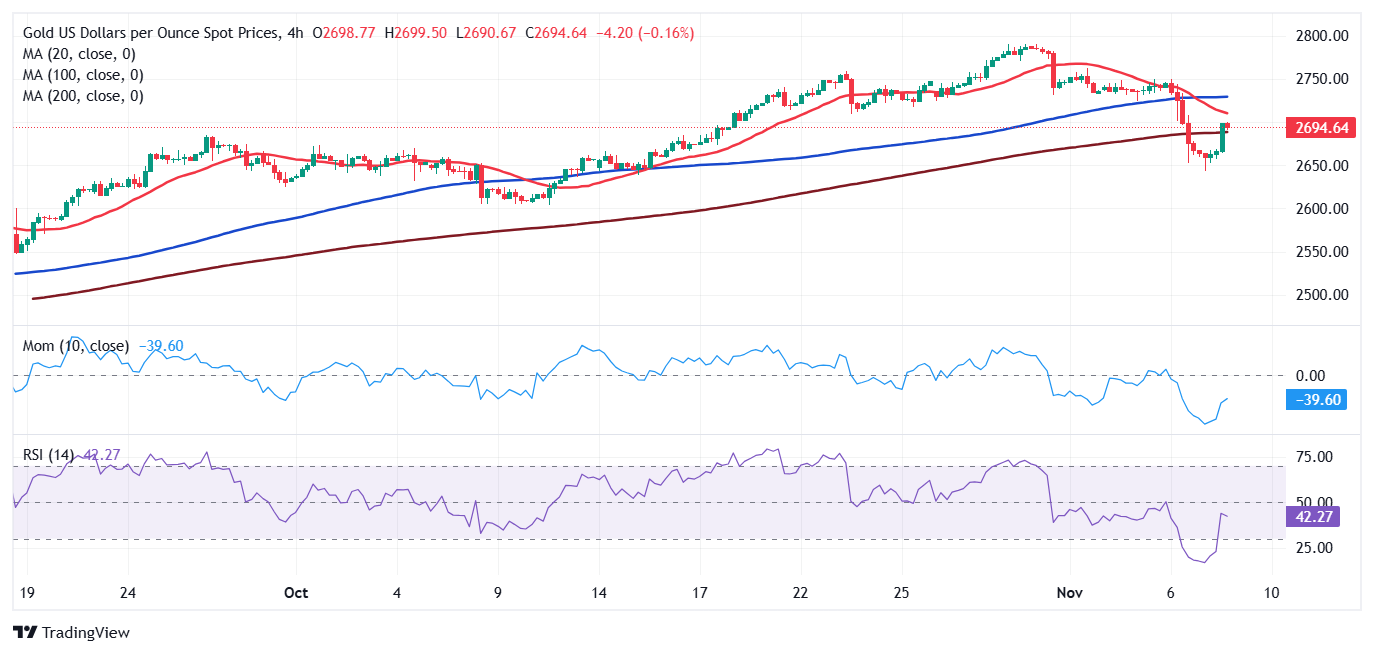
From a technical point of view, the upside seems limited for XAU/USD. In the daily chart, the bright metal remains below its 20 Simple Moving Average (SMA), which anyway maintains its bullish slope. The 100 and 200 SMAs also head north but far below the current level, suggesting the long-term bias is bullish. Finally, technical indicators turned marginally higher, with the Momentum hovering within neutral levels and the Relative Strength Index (RSI) indicator developing around 50. The modest uptick is not enough, however, to confirm additional gains ahead.
The 4-hour chart shows technical indicators have corrected extreme oversold conditions but also that the advance loses steam within negative levels. At the same time, the pair surpassed a flat 200 SMA, which currently provides support at around $2,687.40. Nevertheless, the 20 SMA maintains its downward slope above the current level and moves further below the 100 SMA, limiting the bullish potential in the near term.
Support levels: 2,687.50 2,673.90 2,652.25
Resistance levels: 2,700.00 2,714.90 2,731.45
Premium
You have reached your limit of 3 free articles for this month.
Start your subscription and get access to all our original articles.
Author

Valeria Bednarik
FXStreet
Valeria Bednarik was born and lives in Buenos Aires, Argentina. Her passion for math and numbers pushed her into studying economics in her younger years.


