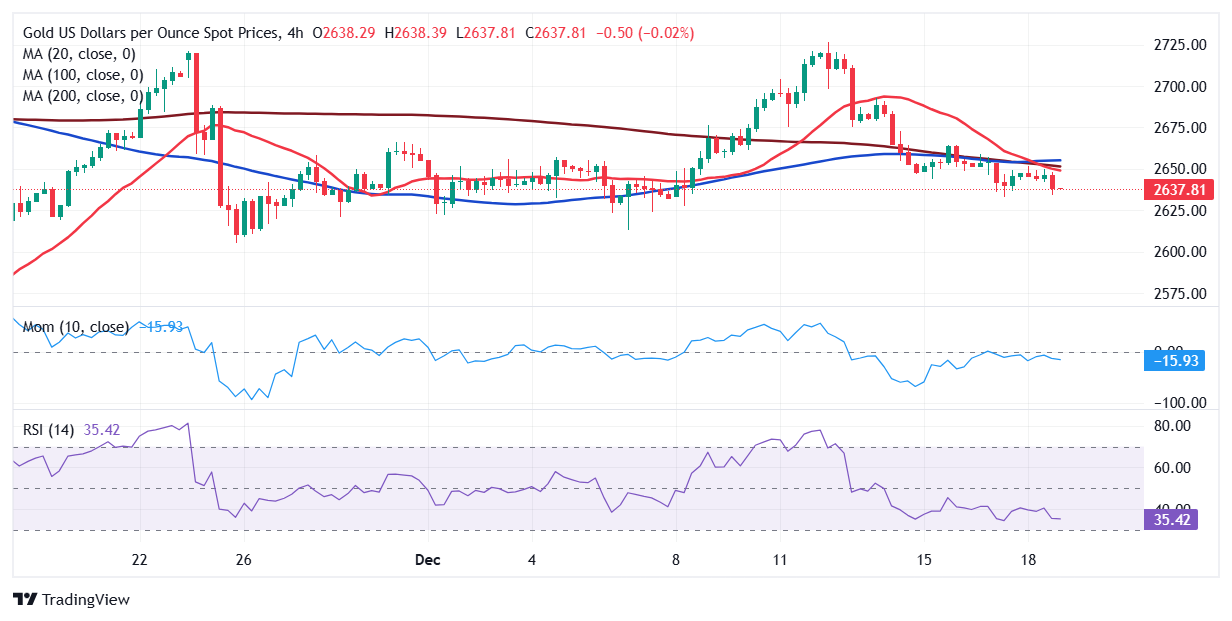
XAU/USD Current price: $2,637.81

  • Federal Reserve expected to trim benchmark rate by 25 bps, offer a glance into 2025.
  • The US Dollar holds near its recent weekly highs against most major rivals.
  • XAU/USD is technically bearish in the near term, aims to pierce the weekly low at $2,633.

Speculative interest holds its breath on Wednesday, resulting in little action across the FX board. Investors await the Federal Reserve’s (Fed) monetary policy announcement as the central bank ends its two-day meeting. United States (US) policymakers are expected to cut the main interest rate by 25 basis points (bps) and share their views on key macroeconomic indicators and the future of monetary policy through the Summary of Economic Projections (SEP) or dot-plot.

Finally, Chairman Jerome Powell will offer a press conference. Market players will be looking for clues on upcoming decisions, while Powell will do as usual and pour cold water on any speculation that can disrupt the market’s behaviour.

Generally speaking, the US Dollar (USD) is strong across the FX board, trading near its weekly highs against most major rivals. The basic idea of the market reaction following the aforementioned events is whether the outcome is dovish or hawkish. A hawkish central bank tends to translate into a stronger local currency, while the opposite scenario is also valid, with a dovish stance resulting in a weaker currency. Things, however, are never that straightforward.

The Fed is expected to cut rates (dovish) while delivering a hawkish message. The hawkish cut is priced in, and the market will react to 2025 expectations.

XAU/USD short-term technical outlook

Technically,  the daily chart for the XAU/USD pair shows the pair is down for a second consecutive day, although it is holding above the weekly low set at $2,633. In the same chart, a flat 20 Simple Moving Average (SMA) provides dynamic resistance at around $2,655. The 100 and 200 SMAs keep heading higher, well below the current level, limiting the long-term bearish potential. Finally, technical indicators are neutral-to-bearish, developing around their midlines and failing to provide clear directional clues.

The 4-hour chart shows that the risk skews to the downside. The XAU/USD pair trades below all its moving averages, while the 20 SMA is heading firmly lower after crossing below directionless 100 and 200 SMAs. At the same time, technical indicators gain downward traction within negative levels, supporting a fresh leg lower beyond the $2,633 weekly low.

 Support levels: 2,633.00 2,617.90 2,603.15

Resistance levels: 2,643.40 2,657.30, 2,672.70  

Information on these pages contains forward-looking statements that involve risks and uncertainties. Markets and instruments profiled on this page are for informational purposes only and should not in any way come across as a recommendation to buy or sell in these assets. You should do your own thorough research before making any investment decisions. FXStreet does not in any way guarantee that this information is free from mistakes, errors, or material misstatements. It also does not guarantee that this information is of a timely nature. Investing in Open Markets involves a great deal of risk, including the loss of all or a portion of your investment, as well as emotional distress. All risks, losses and costs associated with investing, including total loss of principal, are your responsibility. The views and opinions expressed in this article are those of the authors and do not necessarily reflect the official policy or position of FXStreet nor its advertisers. The author will not be held responsible for information that is found at the end of links posted on this page.

If not otherwise explicitly mentioned in the body of the article, at the time of writing, the author has no position in any stock mentioned in this article and no business relationship with any company mentioned. The author has not received compensation for writing this article, other than from FXStreet.

FXStreet and the author do not provide personalized recommendations. The author makes no representations as to the accuracy, completeness, or suitability of this information. FXStreet and the author will not be liable for any errors, omissions or any losses, injuries or damages arising from this information and its display or use. Errors and omissions excepted.

The author and FXStreet are not registered investment advisors and nothing in this article is intended to be investment advice.

Recommended Content


Recommended Content

Editors’ Picks

EUR/USD struggles to hold above 1.1000 after mixed EU data

EUR/USD struggles to hold above 1.1000 after mixed EU data

EUR/USD is having a difficult time stabilizing above 1.1000 in the European session on Monday. The Eurozone Sentix Investor Confidence slumped to -19.5 in April while the annual February Retail Sales jumped 2.3%, limiting the pair's upside despite the broad US Dollar weakness.

EUR/USD News
GBP/USD reverses below 1.2900 despite US Dollar weakness

GBP/USD reverses below 1.2900 despite US Dollar weakness

GBP/USD fails to sustain the recovery and reverses below 1.2900 in European trading on Monday. The pair shrugs off broad US Dollar weakness as risk sentiment takes a fresh hit, with European traders hitting their desks, weighing on the risk sensitive Pound Sterling. 

GBP/USD News
Gold price holds above $3,000 amid a global meltdown; bulls seem non-committed

Gold price holds above $3,000 amid a global meltdown; bulls seem non-committed

Gold price attracts some sellers near the $3,055 support-turned-resistance and stalls its intraday recovery from the $2,972-2,971 area, or a nearly four-week low touched earlier this Monday. Investors continue to unwind their bullish positions to cover losses from a broader meltdown across the global financial markets

Gold News
Solana Price Forecast: Bears gain momentum as SOL falls below $100

Solana Price Forecast: Bears gain momentum as SOL falls below $100

Solana (SOL) extends its loss by over 7% and falls below the $100 mark at the time of writing on Monday after crashing 15.15% last week. Coinglass data shows that SOL’s leveraged traders wiped out nearly $70 million in liquidations in the last 24 hours.

Read more
Strategic implications of “Liberation Day”

Strategic implications of “Liberation Day”

Liberation Day in the United States came with extremely protectionist and inward-looking tariff policy aimed at just about all U.S. trading partners. In this report, we outline some of the more strategic implications of Liberation Day and developments we will be paying close attention to going forward.

Read more
The Best brokers to trade EUR/USD

The Best brokers to trade EUR/USD

SPONSORED Discover the top brokers for trading EUR/USD in 2025. Our list features brokers with competitive spreads, fast execution, and powerful platforms. Whether you're a beginner or an expert, find the right partner to navigate the dynamic Forex market.

Read More

Majors

Cryptocurrencies

Signatures

Best Brokers of 2025