Gold Price Forecast: XAU/USD looks to challenge three-month highs despite Fed’s tapering jitters
- Gold price targets $1890 once again as Treasury yields retreat.
- FOMC minutes revive tapering talk and spook investors.
- Crypto market volatility likely to keep gold underpinned.

Gold price (XAU/USD) witnessed a volatile session on Wednesday, initially falling to the $1850 zone before rebounding firmly to renew three-month highs of $1890. The pullback, however, lost legs, as the gold price once again retraced towards $1860.
The price of gold bounced back towards the $1900 mark after a risk-aversion gripped markets on a massive collapse across the crypto board. Investors flocked to safety in the traditional safe-haven gold, as most major crypto assets lost as much as 30% of their value during the crash. However, gold price took a U-turn and retraced almost entire gains after the FOMC April meeting’s minutes revealed the board members’ readiness to kick start the tapering debate in the upcoming meetings. The US dollar rallied alongside the Treasury yields on slightly hawkish FOMC minutes, with the 10-year rates climbing to weekly highs at 1.67%.
This Thursday, gold price is looking to extend the recovery from near the $1860 region amid a retreat in the US yields, as markets weigh in the implications of the FOMC minutes. Also, the persisting volatility in the crypto space keeps the buoyant tone intact around gold. However, the further upside appears elusive unless the $1900 mark is recaptured on a sustained basis. Also, the dollar and yield dynamics will remain in play amid a revival of the Fed’s tapering narrative. The US weekly jobless claims will be closely watched for near-term trading opportunities.
Gold Price Chart - Technical outlook
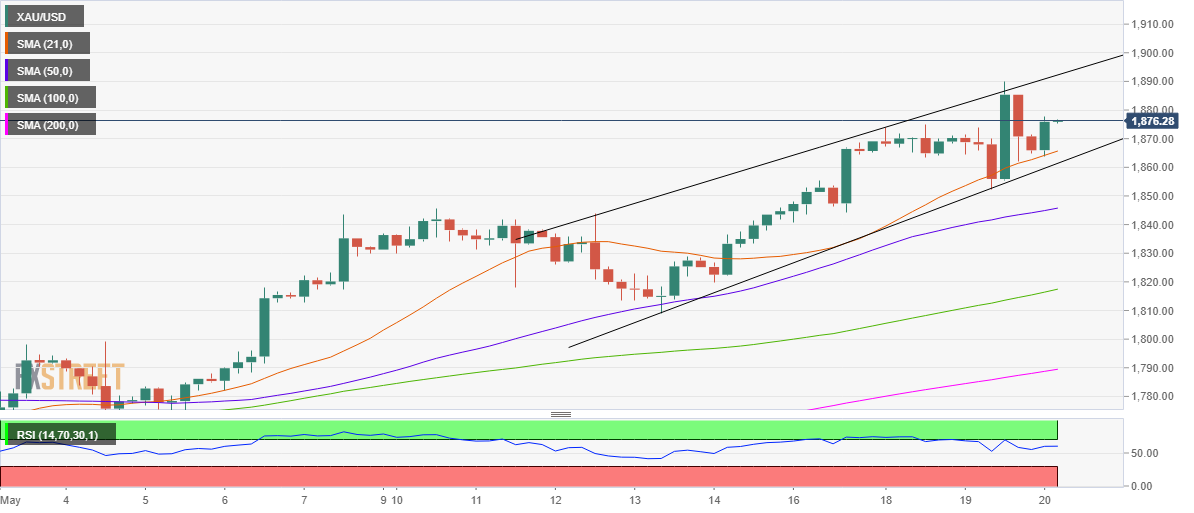
Gold: Four-hour chart
Gold price is trending within a rising wedge formation on the four-hour chart, having recovered from troughs near the $1808 region.
Gold bulls have managed to defend the lower boundary of the wedge, now placed at $1861 while the resistance aligns at $1892.
The price remains on track to test the abovementioned rising wedge resistance, as the Relative Strength Index (RSI) continues to hold firmer above the midline.
Also, the fact that gold price trades comfortably above the 21-simple moving average (SMA) at $1866 adds credence to the additional upside.
However, a breach of the 21-SMA could put the wedge support at risk once again. A four-hour candlestick closing below the latter could negate the near-term bullish momentum.
The next target in sight for the sellers is seen at the upward-sloping 50-SMA at $1846.
Premium
You have reached your limit of 3 free articles for this month.
Start your subscription and get access to all our original articles.
Author

Dhwani Mehta
FXStreet
Residing in Mumbai (India), Dhwani is a Senior Analyst and Manager of the Asian session at FXStreet. She has over 10 years of experience in analyzing and covering the global financial markets, with specialization in Forex and commodities markets.


