Gold Price Forecast: XAU/USD extends slide below $2,350.00

XAU/USD Current price: $2,344.77
- The US Dollar benefits from upbeat United States data, risk-off mood.
- Hawkish FOMC meeting Minutes suggest rate cuts won’t come until September.
- XAU/USD is pressuring a critical Fibonacci support and bears an aim for lower lows.
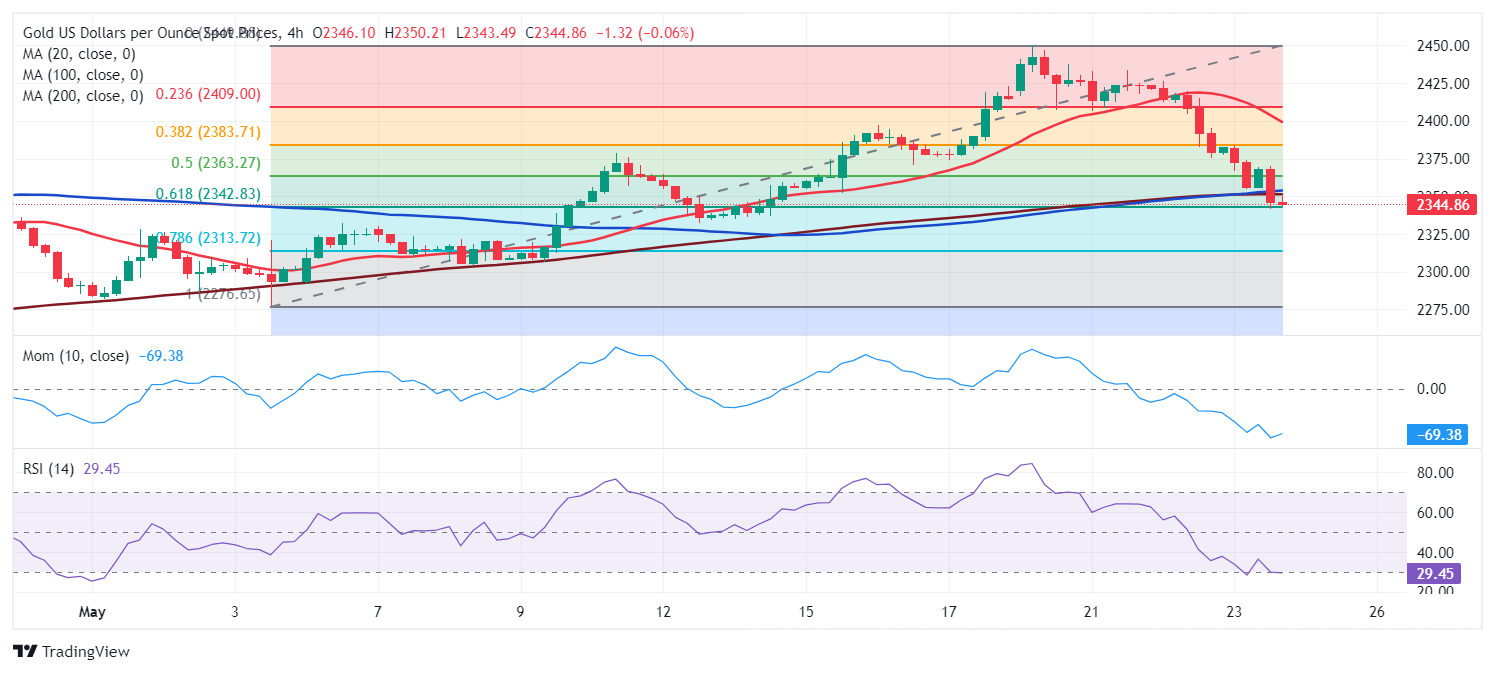
Spot Gold kept falling on Thursday, with XAU/USD trading as low as $2,340.28 at the beginning of the American session. The bright metal is sharply down for a second consecutive week, with the US Dollar initially taking advantage of hawkish Federal Open Market Committee (FOMC) meeting Minutes. The document, released on Wednesday, showed officials expressed concerns about the lack of progress towards their goal of 2% but still believe inflation would ease. A rate cut, however, seems unlikely before September. The announcement weighed on stock markets, pushing Wall Street into a negative close.
The US Dollar further advanced on Thursday following the release of upbeat United States (US) data. The country reported Initial Jobless Claims for the week ended May 17 declined to 215K from the previous 223K, while better than the 220K expected. Furthermore, S&P Global released the preliminary estimates of the May Purchasing Manager Indexes (PMIs), which showed business activity growth accelerated sharply to its fastest for just over two years in May, according to provisional data. The Composite PMI improved to 54.4 from 51.3 in April, while the Manufacturing PMI recovered to 50.9 after printing 50 in the previous month. Finally, the services index jumped to 54.8, its highest in a year.
Finally, Wall Street opened mixed, with the Dow Jones Industrial Average losing roughly 0.70%, while the S&P500 and the Nasdaq Composite hold into the green.
XAU/USD short-term technical outlook
XAU/USD trades around the 61.8% Fibonacci retracement of the rally between $2,277.20 and the record peak at $2,449.92, at $2,344.70. Technical readings in the daily chart show the momentum remains strong, as indicators extended their sharp slides, with the Momentum holding above its 100 line but the Relative Strength Index (RSI) indicator piercing its midline and supporting another leg south. At the same time, XAU/USD is battling with a now flat 20 Simple Moving Average (SMA), while the 100 and 200 SMAs keep heading north far below the current level.
The risk skews to the downside in the near term. XAU/USD trades below all its moving averages in the 4-hour chart, with the 20 SMA turning firmly south, well above the current level. At the same time, technical indicators maintain their downward slopes at fresh April lows and without signs of bearish exhaustion despite entering oversold readings.
Support levels: 2,340.20 2,323.70 2,307.10
Resistance levels: 2,354.20 2,372.90 2,384.15
Author

Valeria Bednarik
FXStreet
Valeria Bednarik was born and lives in Buenos Aires, Argentina. Her passion for math and numbers pushed her into studying economics in her younger years.

















