Gold Price Forecast: XAU/USD eases toward $2,310 amid a better market mood

XAU/USD Current price: $2,313.24
- Substantial gains among European indexes weigh on safe-haven demand.
- Treasury yields retreated further from recent multi-month highs, weighing on the USD.
- XAU/USD trades with a softer tone, but absent USD demand limits the downside.
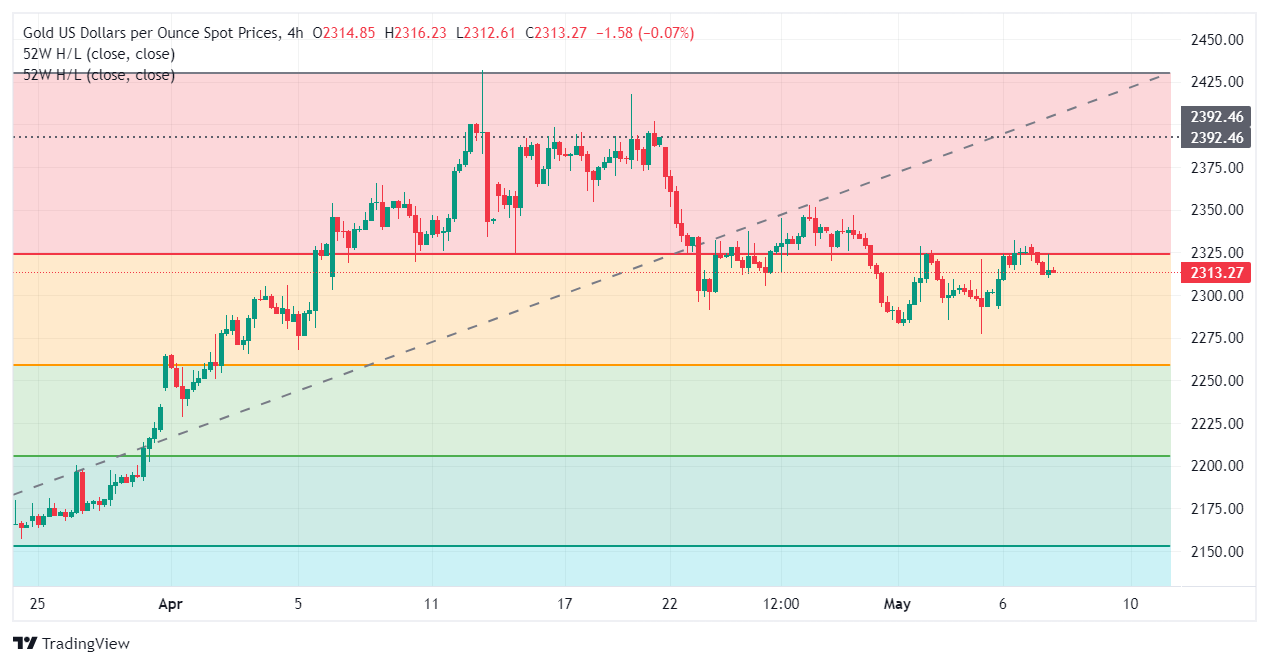
Spot Gold retreated from the $2,330 price zone and trades in the red on Tuesday, although still confined to familiar levels. The slide can be attributed to a better market mood, as European indexes closed with substantial gains. The lack of momentum, however, resulted from United States (US) indexes consonsolidating around weekly highs yet showing little signs of life. Gains among US indexes are modest, as investors lack a clear directional catalyst.
The United States session included a speech from Federal Reserve (Fed) Minneapolis President Neel Kashkari, who said that the most likely scenario is that interest rates will stay on hold for an extended period. He also said that raising rates is not the most likely but cannot be ruled out. Finally, Kashkari said he would need to see multiple readings on easing inflation to be confident enough to cut rates. His dovish words came as no surprise and had a limited impact on financial markets.
Meanwhile, easing US government bond yields weigh on US Dollar demand. The 10-year Treasury note offers 4.43%, down 5 basis points on the day, while the 2-year note yields 4.80%, down 1 bps and further away from its recent peak above 5%.
XAU/USD short-term technical outlook
Technically, the daily chart for XAU/USD shows it keeps meeting sellers around a Fibonacci level, the 23.6% retracement of the April/May rally at $2,326.50. The next Fibonacci level and critical support comes at $2,260.80, a potential bearish target should Gold finally lose the $2,300 mark. In the mentioned chart, technical indicators remain within negative levels, with neutral-to-bearish slopes, reflecting the absence of buying interest. At the same time, a flat 20 Simple Moving Average offers dynamic resistance around $2,339,00, while the longer moving averages maintain their bullish slopes far below the current level.
In the near term, and according to the 4-hour chart, XAU/USD is neutral. Technical indicators head nowhere around their midlines, while the pair stands midway between a bullish 200 SMA and a bearish 100 SMA. At the same time, the pair hovers around a flat 20 SMA. Overall, the risk skews to the downside, although limited by absent US Dollar demand.
Support levels: 2,310.40 2,291.20 2,276.50
Resistance levels: 2,326.50 2,340.15 2,356.90
Author

Valeria Bednarik
FXStreet
Valeria Bednarik was born and lives in Buenos Aires, Argentina. Her passion for math and numbers pushed her into studying economics in her younger years.
















