Gold Price Forecast: XAU/USD challenges critical support

XAU/USD Current price: $2,363.12
- The United States Gross Domestic Product was much better than expected in Q2.
- Stock markets bounced amid speculation the US economy will dodge a recession.
- XAU/USD could extend its slump towards the $2,300 region in the upcoming sessions.
Gold remains under selling pressure on Thursday, trading near a fresh multi-week low of $2,357.92. The bright metal eased throughout the first half of the day amid a dismal market mood. Equities led the way, falling on the back of weak earning reports and a sharp slide in the tech sector. The US Dollar pared gains mid-European session as investors await United States (US) first-tier data.
American figures were overall encouraging, further fueling the US Dollar against Gold. The US Bureau of Economic Analysis (BEA) reported that the local economy grew at an annualized pace of 2.8% in the second quarter of the year, while inflation in the same period was lower than previously estimated. The core Personal Consumption Expenditures Price Index rose 2.9% QoQ, easing from the 3.7% posted in the first quarter, yet above expectations of 2.7%. Furthermore, the Gross Domestic Product (GDP) Price Index rose 2.3% in the same period, below the market expectation of 2.6%.
Furthermore, the US reported that Initial Jobless Claims for the week ended July 19 rose by 235K, better than anticipated, while Durable Goods Orders in June disappointed by falling 6.6%. The Greenback retained its strength against safe-haven rivals but eased against high-yielding ones as generally upbeat US figures pushed Wall Street into positive ground, as the recession ghost got spooked further away.
As the dust settles, speculative interest continues to believe there is a 100% chance the Fed will trim rates in September, while the odds for an additional rate cut in November increase to roughly 70%, according to the CME FedWatch Tool.
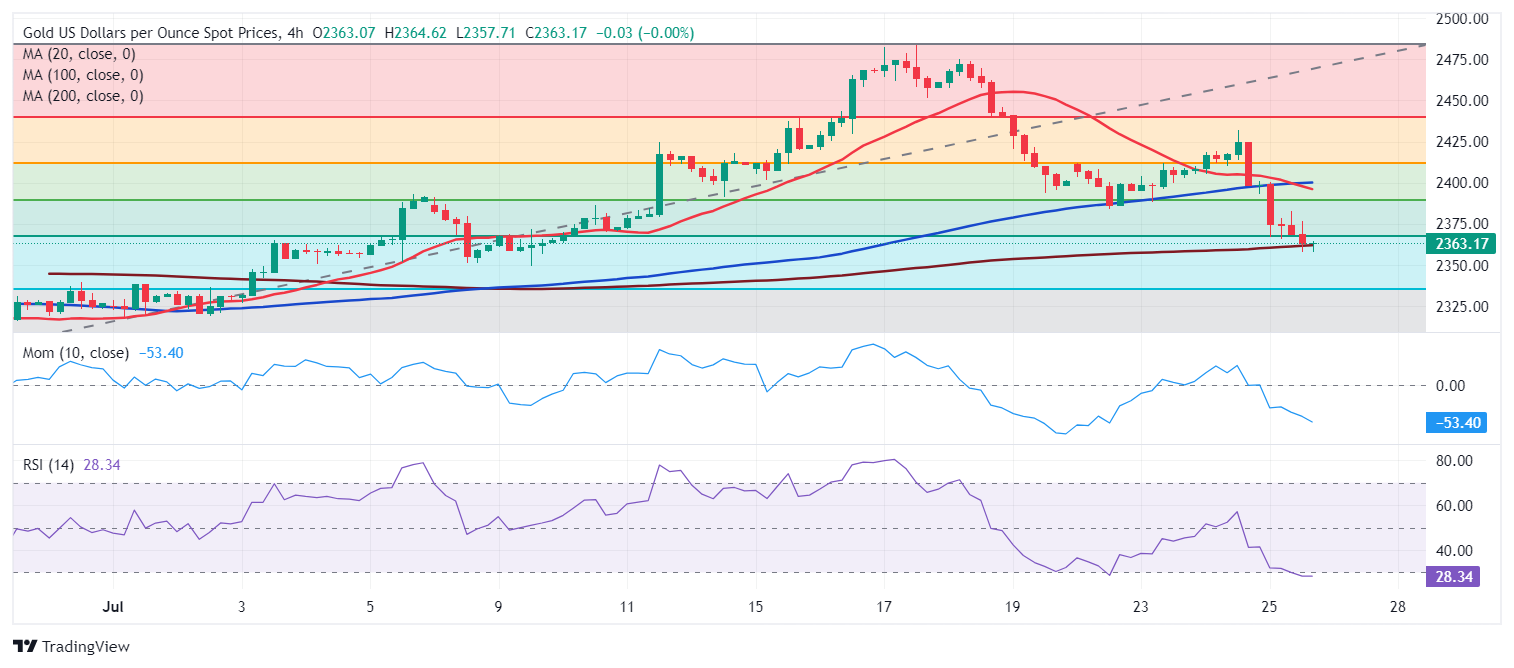
XAU/USD short-term technical outlook
XAU/USD resumed its bearish trend and is currently trading below $2,366.30, the 61.8% Fibonacci retracement of the $2,293.54/$2,483.68 rally, suggesting further slides ahead. Technical readings in the daily chart confirm the bearish case, as technical indicators crossed their midlines into negative territory, maintaining their firmly bearish slopes. Furthermore, XAU/USD broke below a now mildly bullish 20 Simple Moving Average (SMA), now converging with the 50% retracement of the mentioned slide at $2,389.30, reinforcing the resistance area.
The bearish case is even stronger in the near term. In the 4-hour chart, a bearish 20 SMA crosses below a directionless 100 SMA in the $2,400 area, suggesting increased selling interest. At the same time, the pair is pressuring a flat 200 SMA, while technical indicators accelerated their slides, heading south almost vertically. Finally, technical indicators maintain their sharp downward slopes, with the Relative Strength Index (RSI) indicator giving no signs of downward exhaustion despite hovering around 27.
Support levels: 2,347.20, 2,332.50 2,318.40
Resistance levels: 2,366.30 2,381.90 2,395.20
Author

Valeria Bednarik
FXStreet
Valeria Bednarik was born and lives in Buenos Aires, Argentina. Her passion for math and numbers pushed her into studying economics in her younger years.


