Gold Price Forecast: Why downside appears more compelling for XAU/USD?
- Gold price turns red for the first time in a week amid firmer DXY.
- Treasury yields recover post-FOMC minutes, despite risk-off mood.
- Gold eyes more losses amid symmetrical triangle breakdown on the 1H chart.

Gold price closed in the green on Wednesday above $1800 but remained within Tuesday’s trading, as the US dollar’s strength countered the slump in Treasury yields. Heading into the critical June FOMC meeting’s minutes, gold price advanced amid pre-minutes caution and worries over covid contagion, which boosted the safe-haven demand for Treasuries while downing the yields. However, the greenback’s advance amid risk-off mood capped the gains in gold.
Meanwhile, the dollar changed its course on the FOMC minutes and edged lower across the board, although failed to lift the sentiment around gold price. The minutes turned out rather mixed, with the Fed policymakers hinting towards tapering talks in the coming minutes while noting the committee's standard of "substantial further progress" was generally seen as not having yet been met. The not-so hawkish Fed minutes offered some relief to Wall Street indices, keeping a lid on gold’s upside.
In the aftermath of the FOMC minutes, gold is reversing its recent run to three-week tops of $1815, in the red for the first time in a week. The resurgent demand for the US dollar amid risk-averse market conditions, in light of rising coronavirus cases in Asia and the Fed’s tapering expectations, weighs negatively on the USD-denominated gold. Further, a recovery in the US 10-year Treasury yields from five-month lows also collaborates with the downside in the non-yielding gold. Later today, the US Jobless Claims data will be eyed for fresh dollar trades. In the meantime, the dynamics in the yields and the greenback will continue to play out, investors await fresh covid updates and ECB’s decision on its inflation target.
Gold Price Chart - Technical outlook
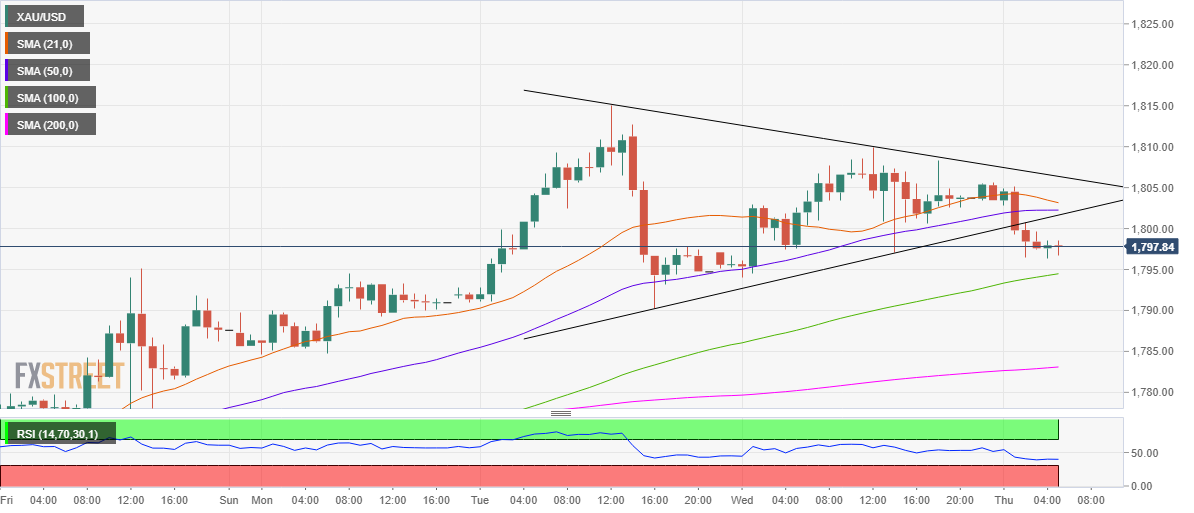
Gold: Hourly chart
As explained here, gold price failed to deliver a daily closing above the 21-DMA, then at $1804, on Wednesday, which likely recalled the sellers.
On the hourly chart, gold price confirmed a symmetrical triangle breakdown on a sustained breach of the $1800 support.
The bears extend their control, as gold price closes in on the upward-sloping 100-Hourly Moving Average (HMA) at $1794.
If the selling pressure intensifies, a test of the July 6 low at $1790 remains on the cards.
The Relative Strength Index (RSI) is flatlined below 50.00, remaining in favor of the bears.
On the flip side, if gold bulls manage to recapture the key resistance around $1802-$1803 (21, 50 SMAs confluence), then the further upside could open towards the triangle resistance at $1806.
Acceptance above the latter would invalidate the downside breakout of the triangle, calling for a fresh upswing towards $1815.
Premium
You have reached your limit of 3 free articles for this month.
Start your subscription and get access to all our original articles.
Author

Dhwani Mehta
FXStreet
Residing in Mumbai (India), Dhwani is a Senior Analyst and Manager of the Asian session at FXStreet. She has over 10 years of experience in analyzing and covering the global financial markets, with specialization in Forex and commodities markets.