Gold Price Forecast: For how long can XAU/USD defend 50-Simple Moving Average on 4H?
- Gold price extends the downside consolidation phase into the second straight day on Wednesday.
- United States Dollar holds firm as recession fears mount on hawkish Federal Reserve rate hike view.
- Gold price defends 50-Simple Moving Average on the 4H chart; downside risks persist.

Gold price is trying hard to stay on the bid so far in this Wednesday’s trading after witnessing a minor bounce on Tuesday. The United States Dollar (USD) is extending its recovery rally, taking the lead from the rebound in the US Treasury bond yields.
Recession fears power the United States Dollar, cap Gold price
The United States Dollar is regaining its upside after a brief pullback earlier in the Asian session this Wednesday, capping the renewed upside in the Gold price. The market mood remains cautious after the four-day sell-off on Wall Street indices, as recession fears resurface alongside concerns over the hawkish US Federal Reserve (Fed) rate hike view.
Top United States banking giants such as JP Morgan and Goldman Sachs warned about the American economy tipping into recession next year, as inflation remains sky high and dents consumer demand. Speaking at a Wall Street Journal (WSJ) event on Tuesday, Goldman Sachs Chief Executive Officer (CEO) David Solomon said that he sees about 65% odds of the US economy entering a recession in 2023.
Meanwhile, investors are worried that a more extended period of higher borrowing costs, courtesy of the recent robust United States economic data-led hawkish Federal Reserve expectations, could also influence an economic slowdown. The Federal Reserve fund futures are now pricing in a 91% chance of a 50 basis point (bps) rate increase in the December meeting while the Fed whisperer and Chief Economics Correspondent for The Wall Street Journal (WSJ), Nick Timiraos, said recently that the terminal rate could go well beyond 5%.
At the time of writing, the US Dollar Index is holding steady at weekly highs near 105.70, tracking the 1% rebound in the US Treasury bond yields across the board. The non-interest-bearing Gold price remains weighed down by the higher-yielding United States rates on government bonds.
Eyes on China’s Covid restrictions relaxation
The economic calendar from the United States continues to remain relatively light, prompting markets to shift their attention to China’s reopening plans. Earlier this week, Reuters reported that China is set to announce ten new COVID-19 management measures as early as Wednesday,” adding that “these supplements the 20 measures unveiled in November that set off a wave of covid-easing steps across the nation. It remains to be seen whether the unveiling of the Chinese measures of relaxing covid restrictions could help lift risk sentiment. On a positive shift in the market’s risk perception, the United States Dollar could snap its recovery mode and come under renewed selling pressure, paving the way for a fresh bounce in Gold price.
Although persisting recession fears are unlikely to fade, especially after the Australian economy slowed down in the September quarter amid fading post-Covid boom. Investors also brace for the revision to the third quarter Eurozone Gross Domestic Product (GDP), which grew at 0.2% QoQ. The US Dollar could stay afloat should the mood remain sour, as recession fears offset China’s reopening optimism.
Gold price technical outlook: Four-hour chart
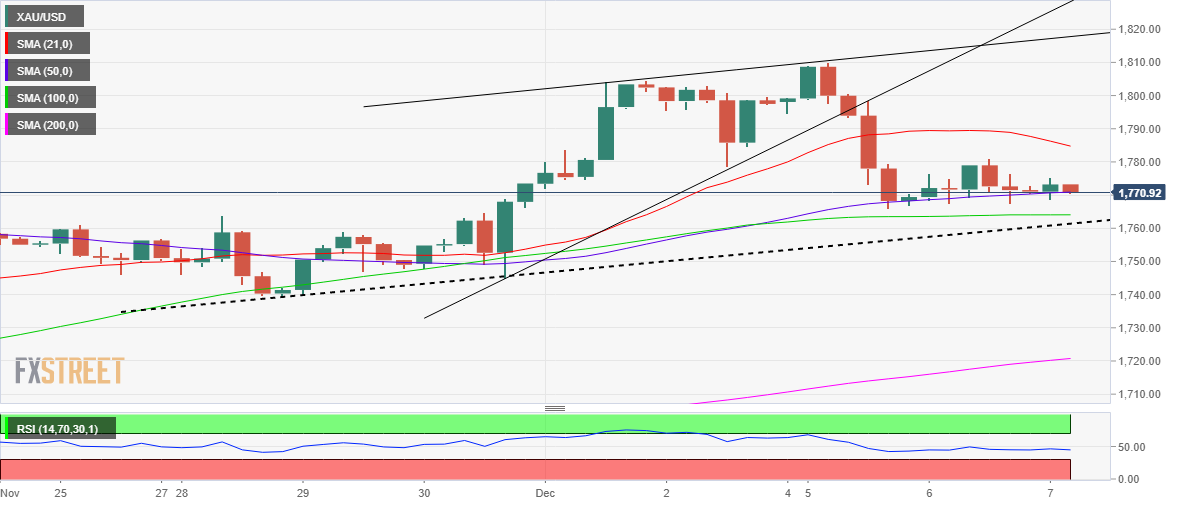
The rising wedge breakdown on the four-hour chart remains in play, keeping the Gold price on the defensive in the lower range of this week’s trading range so far.
A four-hourly candlestick closing below the mildly bullish 50-Simple Moving Average (SMA) at $1,770 is critical to unleashing further downside toward the 100SMA at $1,764. The rising (dashed) trendline support at $1,761 will be next on sellers’ radars.
The Relative Strength Index (RSI) turns lower below the midline, backing the bearish potential in the near term.
If the bulls manage to defend the 50SMA support yet again, the Gold price could stage a modest comeback toward the downward-pointing 21SMA at $1,785. Buyers will try hard to seek acceptance above the $1,800 threshold.
Premium
You have reached your limit of 3 free articles for this month.
Start your subscription and get access to all our original articles.
Author

Dhwani Mehta
FXStreet
Residing in Mumbai (India), Dhwani is a Senior Analyst and Manager of the Asian session at FXStreet. She has over 10 years of experience in analyzing and covering the global financial markets, with specialization in Forex and commodities markets.


