Gold Price Forecast: Fed's dot plot to provide next directional clue for XAU/USD
- Gold continues to fluctuate in weekly range between key levels.
- USD gathers strength amid rising US Treasury bond yields.
- FOMC policymakers will reveal long-term rate expectations in Economic Projections.

The XAU/USD pair moved sideways a little above $1,730 for the majority of the day on Wednesday but came in modest bearish pressure in the early American session. Nevertheless, gold was last seen trading flat on the day at $1,730.
The recent decline in XAU/USD seems to be a product of broad-based USD strength ahead of the all-important FOMC event. In the absence of significant macroeconomic data releases, the US Treasury bond yields' movements continue to impact the USD's market valuation.
The benchmark 10-year US T-bond yield, which staged a downward correction earlier in the week, regained its traction and advanced to its highest level in 13 months at 1.674% on Wednesday. This spike suggests that investors are anticipating the Fed's updated Economic Projections will show that policymakers are expecting the policy tightening to start earlier than signalled in December's dot plot.
The median forecast of FOMC's policymakers was for rates to stay near zero through 2023 with only five of them seeing a liftoff in that year. If the publication later in the session reveals a hawkish shift in long-term rate outlook amid heightened concerns over a sharp increase in inflation, the USD could continue to gather strength and weigh on XAU/USD.
On the other hand, FOMC Chairman Jerome Powell could reassure markets that they will not react to temporary spikes in inflation and reiterate that they will continue to support the economic recovery until they reach the employment and inflation goals. However, Powell's possible dovish comments are likely to limit USD's gains temporarily if it's not supported by economic projections.
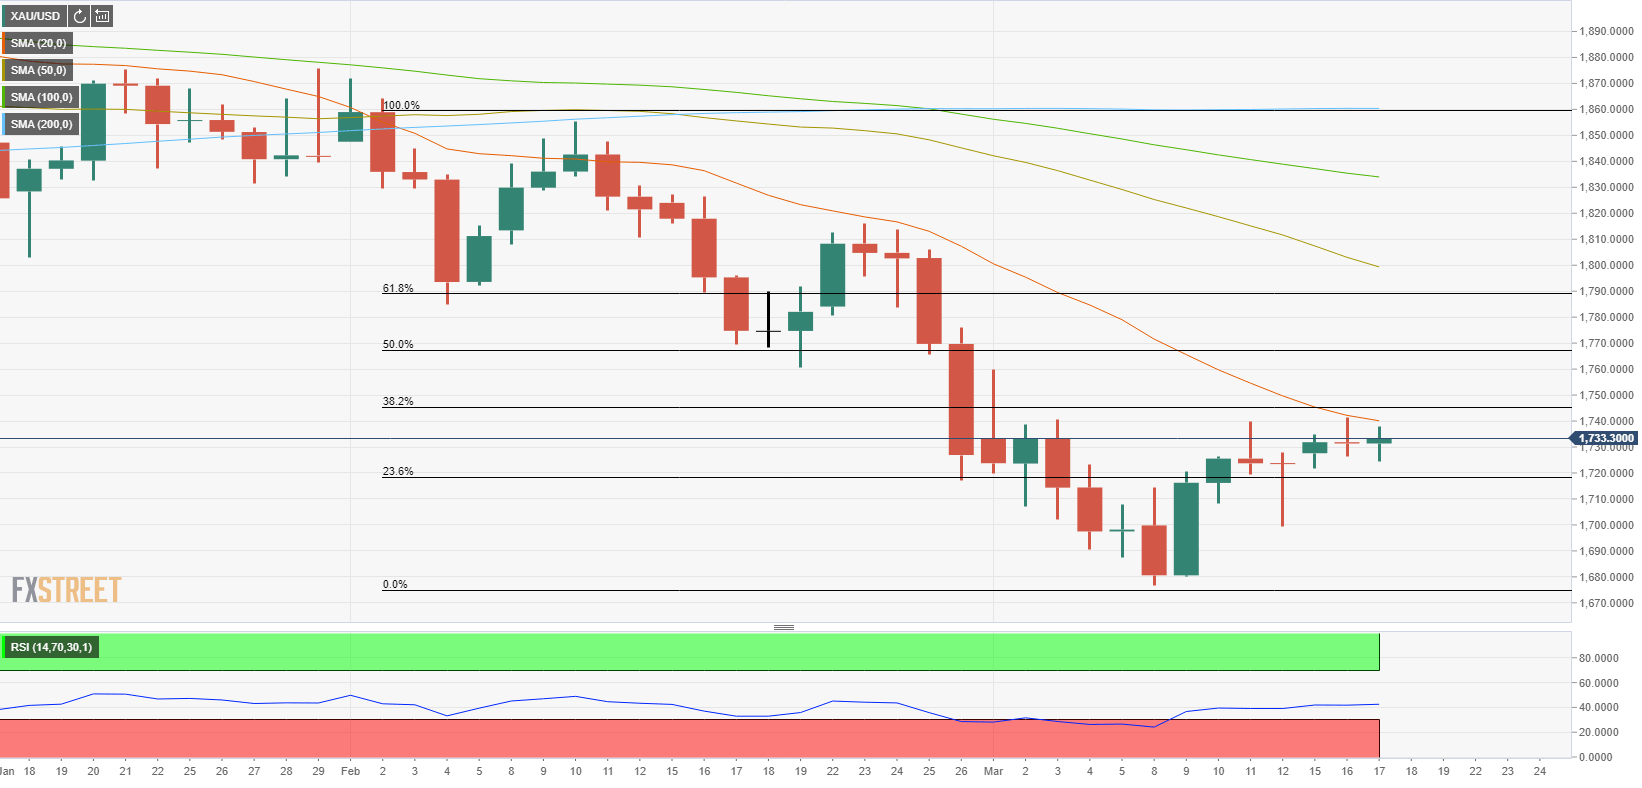
Gold technical outlook
On the daily chart, the price continues to fluctuate between two key Fibonacci levels: The 23.6% retracement of the Feb. 2-Mar. 8 drop at $1,720 and the 38.2% retracement at $1,745.
The 20-day SMA, which is currently located near $1,740, is also reinforcing the resistance area and if XAU/USD manages to clear that area, the next target could be seen at $1,767 (Fibonacci 50% retracement). On the other hand, a daily close below $1,720 could open the door for additional losses toward $1,700 (psychological level).
In the meantime, the Relative Strength Index (RSI) indicator on the daily chart is moving sideways a little below 50, confirming gold's indecisiveness for the time being.
Premium
You have reached your limit of 3 free articles for this month.
Start your subscription and get access to all our original articles.
Author

Eren Sengezer
FXStreet
As an economist at heart, Eren Sengezer specializes in the assessment of the short-term and long-term impacts of macroeconomic data, central bank policies and political developments on financial assets.


