Gold, Chart of the Week: Bulls take on the 38.2% Fibo, now eye the 61.8% golden ratio


  • Gold meets a critical level of resistance on the way to the 61.8% Fibo.
  • Breakout levels will be back in focus beyond the 61.8% or if the 38.2% Fibo holds. 

As per last week's ''Chart of the Week,'' the price of gold has moved into the suspected liquidity area and the question now is whether it can continue further into the M-formation's neckline and key confluence area for the week ahead. 

Gold, last week's analysis

It was started that ''considering the trendline support and the daily M-formation, the technicians would argue that a significant correction of the bearish impulse could be in play first of all.''

The analysis was as follows:

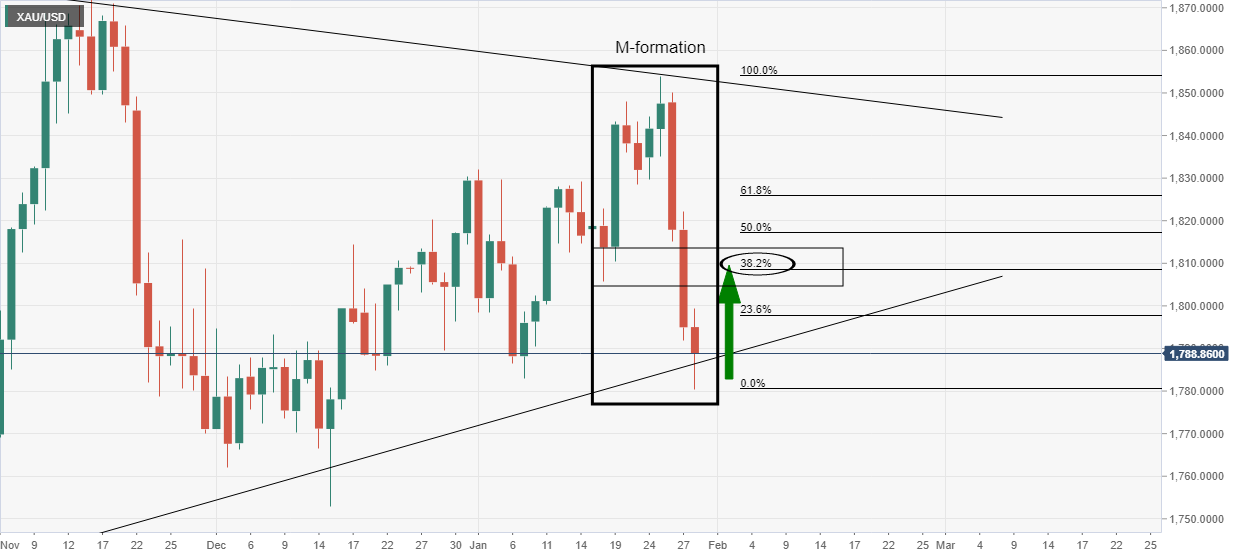
It was explained that ''the M-formation is a reversion pattern that has a high completion rate with the price usually moving back to test at least a significant portion of the prior impulse if not all the way back to the neckline of the M-pattern. In the case above, the 38.2% Fibonacci retracement level near $1,810 has a confluence with prior structure as illustrated.''

Gold, live market

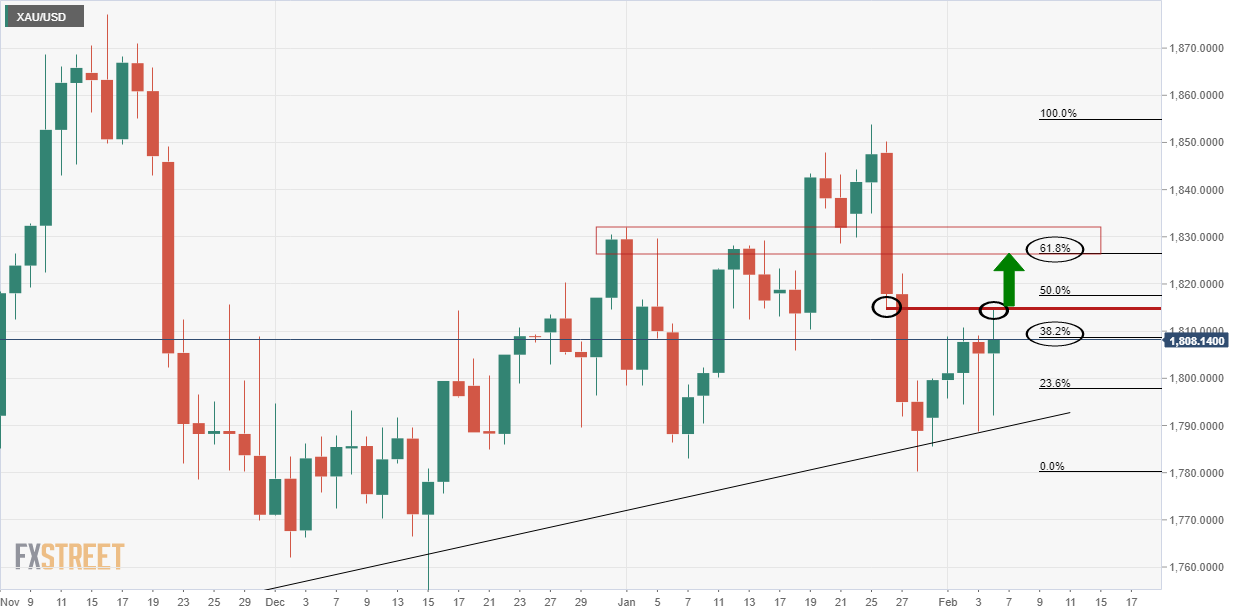
As illustrated, the price has run into the suspected target area for a perfect test of an old low. There has been some strong selling interest in the latter part of the correction which could signify that the bulls are going to have a tough time in their pursuit of deeper liquidity. Nevertheless, we have a 61.8% ratio screaming out from the M-formation's neckline around $1,830. 

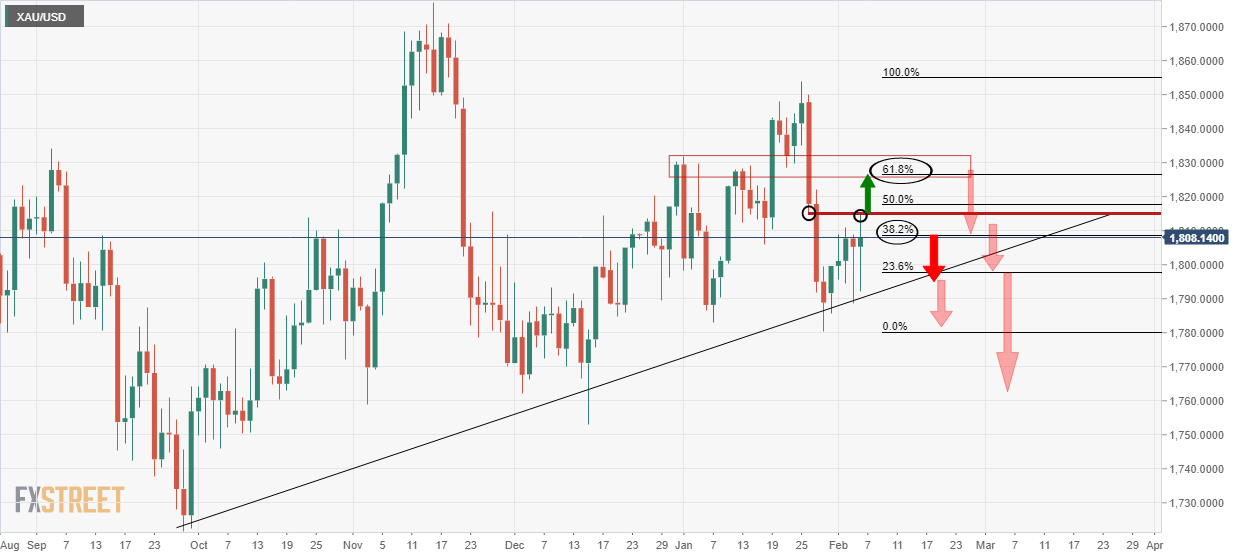
In any case, until the M-formation's neckline is broken, the focus is on the downside:

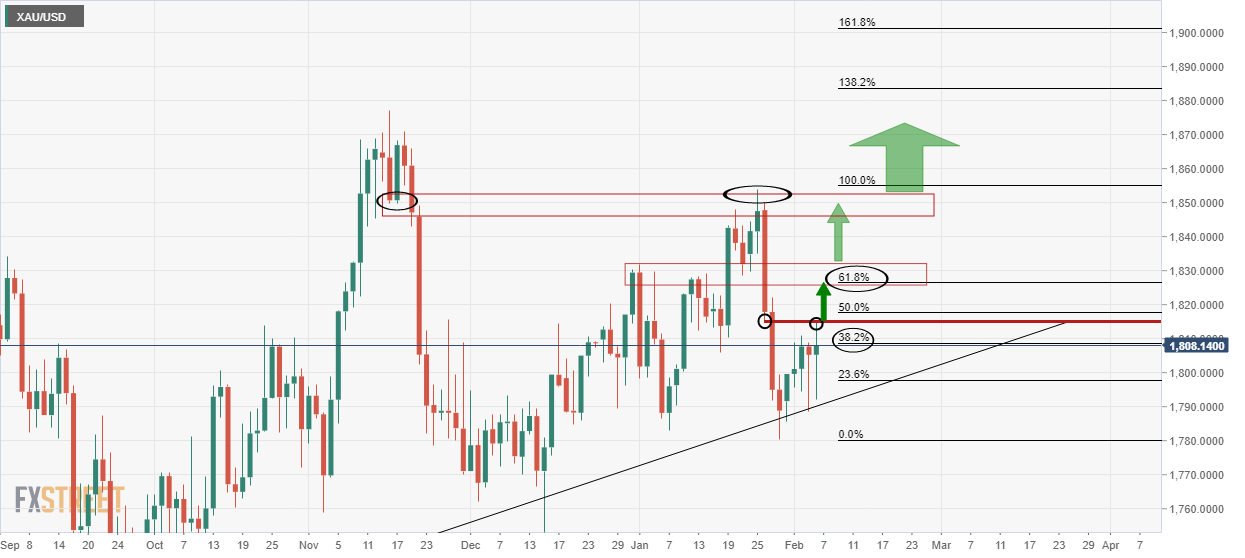
On the other hand, a break of the neckline will put a significant focus on the upside as follows:

Gold, weekly chart

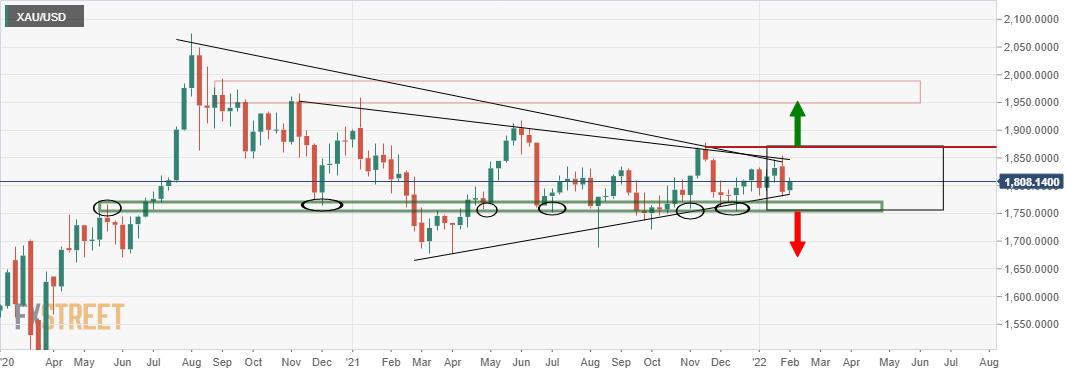
There is a solid horizontal area of support all the way back across the historic timeline to May 2020 between $1,765 to $1,753, the last weekly low for the bears to target on a break of the dynamic trendline support. A break of $1,877 could open the way towards the psychological $2,000 mark over time.

For the week ahead, there will be a focus on the US Consumer Price Index, US equities and how the market will digest elements of the Nonfarm Payrolls that came in was a big surprise, such as wages. Much more talk of a possible 50bps move the next time the Federal Open Market Committee meets and the price of oil will be monitored in terms of inflation prospects for 2022. 

Information on these pages contains forward-looking statements that involve risks and uncertainties. Markets and instruments profiled on this page are for informational purposes only and should not in any way come across as a recommendation to buy or sell in these assets. You should do your own thorough research before making any investment decisions. FXStreet does not in any way guarantee that this information is free from mistakes, errors, or material misstatements. It also does not guarantee that this information is of a timely nature. Investing in Open Markets involves a great deal of risk, including the loss of all or a portion of your investment, as well as emotional distress. All risks, losses and costs associated with investing, including total loss of principal, are your responsibility. The views and opinions expressed in this article are those of the authors and do not necessarily reflect the official policy or position of FXStreet nor its advertisers. The author will not be held responsible for information that is found at the end of links posted on this page.

If not otherwise explicitly mentioned in the body of the article, at the time of writing, the author has no position in any stock mentioned in this article and no business relationship with any company mentioned. The author has not received compensation for writing this article, other than from FXStreet.

FXStreet and the author do not provide personalized recommendations. The author makes no representations as to the accuracy, completeness, or suitability of this information. FXStreet and the author will not be liable for any errors, omissions or any losses, injuries or damages arising from this information and its display or use. Errors and omissions excepted.

The author and FXStreet are not registered investment advisors and nothing in this article is intended to be investment advice.

Recommended Content


Recommended Content

Editors’ Picks

GBP/USD rises to near 1.2540, driven by higher UK GDP

GBP/USD rises to near 1.2540, driven by higher UK GDP

GBP/USD edged higher to near 1.2540 during Asian hours on Friday, buoyed by the release of higher-than-expected UK Gross Domestic Product (GDP) data for the first quarter.

GBP/USD News

EUR/USD: The crucial resistance level will emerge at the 1.0790–1.0800 region

EUR/USD: The crucial resistance level will emerge at the 1.0790–1.0800 region

The EUR/USD pair trades on a softer note near 1.0775 during the early European hours on Friday. The downtick of the major pair is supported by the renewed US Dollar demand amid hawkish comments from Federal Reserve officials. 

EUR/USD News

Gold price attracts some buyers despite hawkish Fedspeak

Gold price attracts some buyers despite hawkish Fedspeak

Gold price edges higher for the second consecutive day on Friday. Weak employment data bolstered the speculation that the weakening economy would force the Fed to cut rates.

Gold News

XRP tests support at $0.50 as Ripple joins alliance to work on blockchain recovery

XRP tests support at $0.50 as Ripple joins alliance to work on blockchain recovery

XRP trades around $0.5174 early on Friday, wiping out gains from earlier in the week, as Ripple announced it has joined an alliance to support digital asset recovery alongside Hedera and the Algorand Foundation. 

Read more

Rate cut optimism fuelled by higher US jobless claims

Rate cut optimism fuelled by higher US jobless claims

With Federal Reserve policy acting as the primary driver of investor sentiment in 2024, renewed optimism surrounding the possibility of rate cuts has propelled the Dow to its most significant rally since December. 

Read more

Majors

Cryptocurrencies

Signatures