Gold and real rates moving in tandem, could signal a big move in yellow metal

There are many ways to view gold, because of how dynamic an asset it has been for a long time. I recently wrote about my perspective on gold as a hedge against monetary policy failure. Today I want to dive into gold and its relationship with real interest rates. For those unfamiliar, a real rate or real yield is one which has been adjusted for inflation. To find the real yield, you take the yield of a specific maturity and deduct the yield of an inflation-protected security of the same maturity. So, let’s say a 5-year note is yielding 2% and the 5-year TIPS (treasury inflation protected security) is yielding 1.5%. That means the real yield is 0.5%. To find the real rate, take the interest rate on your loan and subtract the rate of inflation. So, if your interest rate is say, 3% and inflation is 2% then the real rate you are paying that loan back at is 1%. This same calculation can be used to find your real rate of return on an investment. If your nominal return for the year was 10% and inflation was 5% for the year, then your real rate of return was 5%. Just note that these quick and easy calculations do come with a few flaws. The other, more accurate method of calculating the real interest rate is using Irving Fisher’s equation. Fisher’s equation states that the nominal interest rate is equal to the sum of the real interest rate plus inflation. A little more math is required in Fisher’s equation. But, for the sake of simplicity and tracking gold and real rates on a day-to-day basis, comparing gold with TIPS gets the job done.
Gold has an inverse relationship with real rates. When real rates are high or rising, money flows out of gold and into bonds as there is an opportunity cost in holding gold; it does not pay a yield, whereas bonds do. But when real rates are low or falling, capital flows out of bonds and into an alternative safe investment, often times gold. Over the last ten years there have been several instances when the divergence between gold and real rates have resulted in big moves up in the price of gold in a short time span, which we are going to now take a look at.
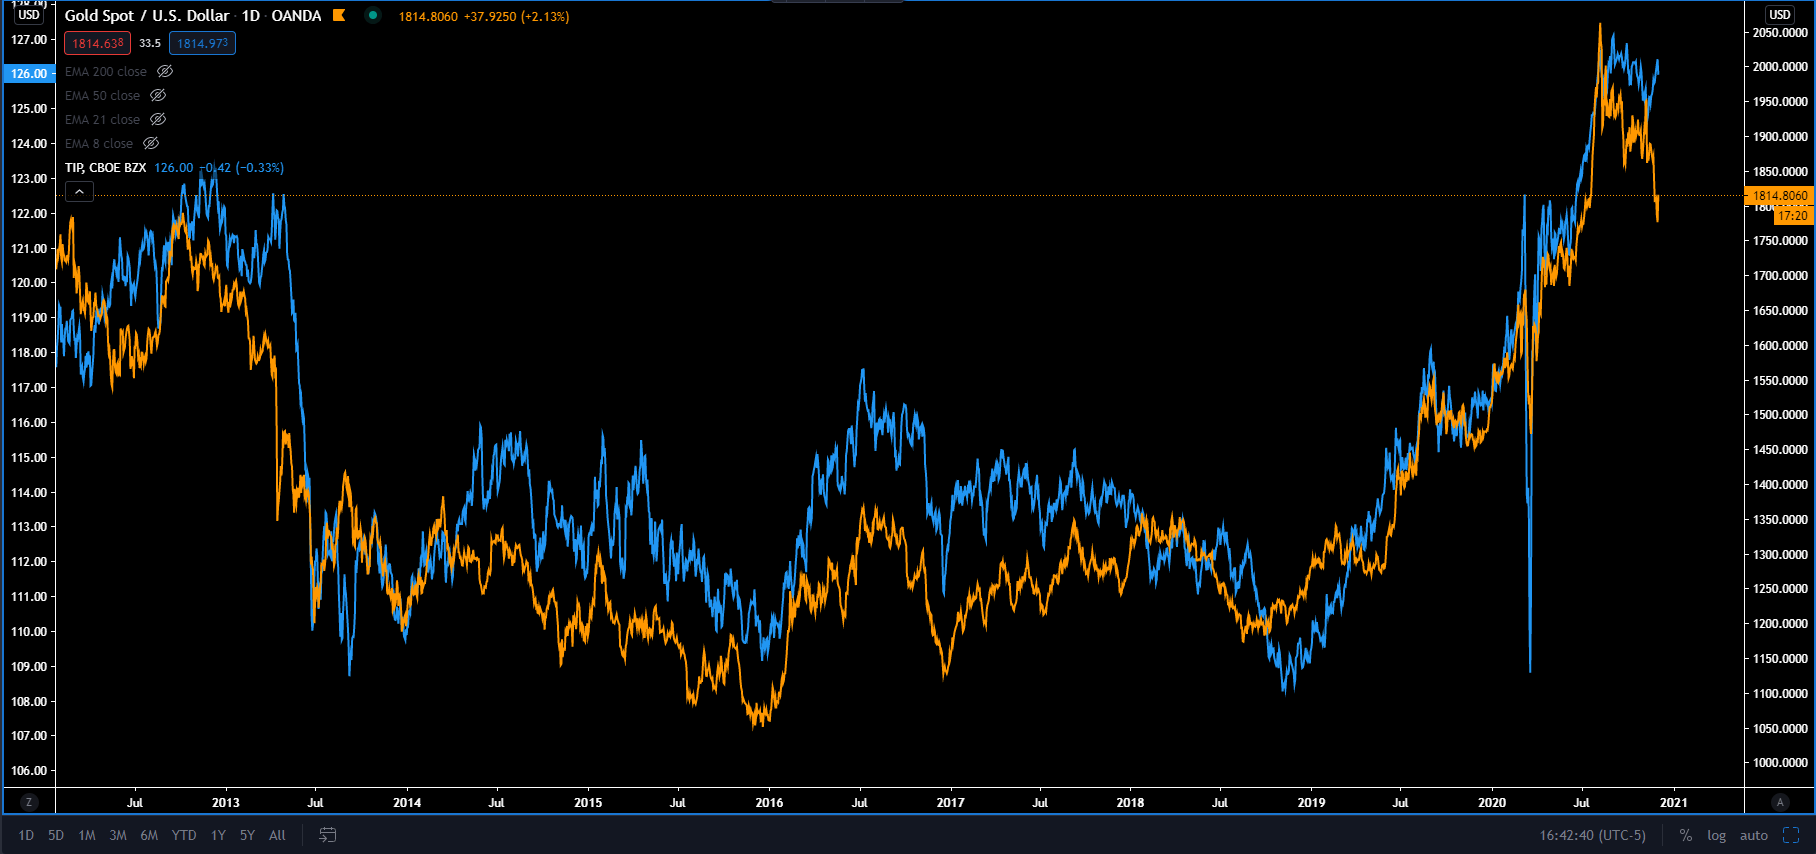
If you look below, I have a chart of gold (orange) and TIP (blue) which is a TIPS ETF. As you can see, there is a very strong positive correlation between the two. The price of TIPS and real rates have an inverse relationship, the same way all bonds have an inverse relationship with their yield. So, if TIPS are rising, then real rates are falling and if TIPS are falling real rates are rising, hence the positive correlation between TIPS and gold. I am a big fan of correlations, but with two assets so closely tied together, it can be difficult to use one to help trade the other. After-all, isn’t that the purpose of correlations? The best thing to do in these situations is look for times when the relationship breaks down and how those assets respond to that breakdown. In the last ten years, the gold and TIPS relationship has broken down several times, as the two assets diverged from one another.
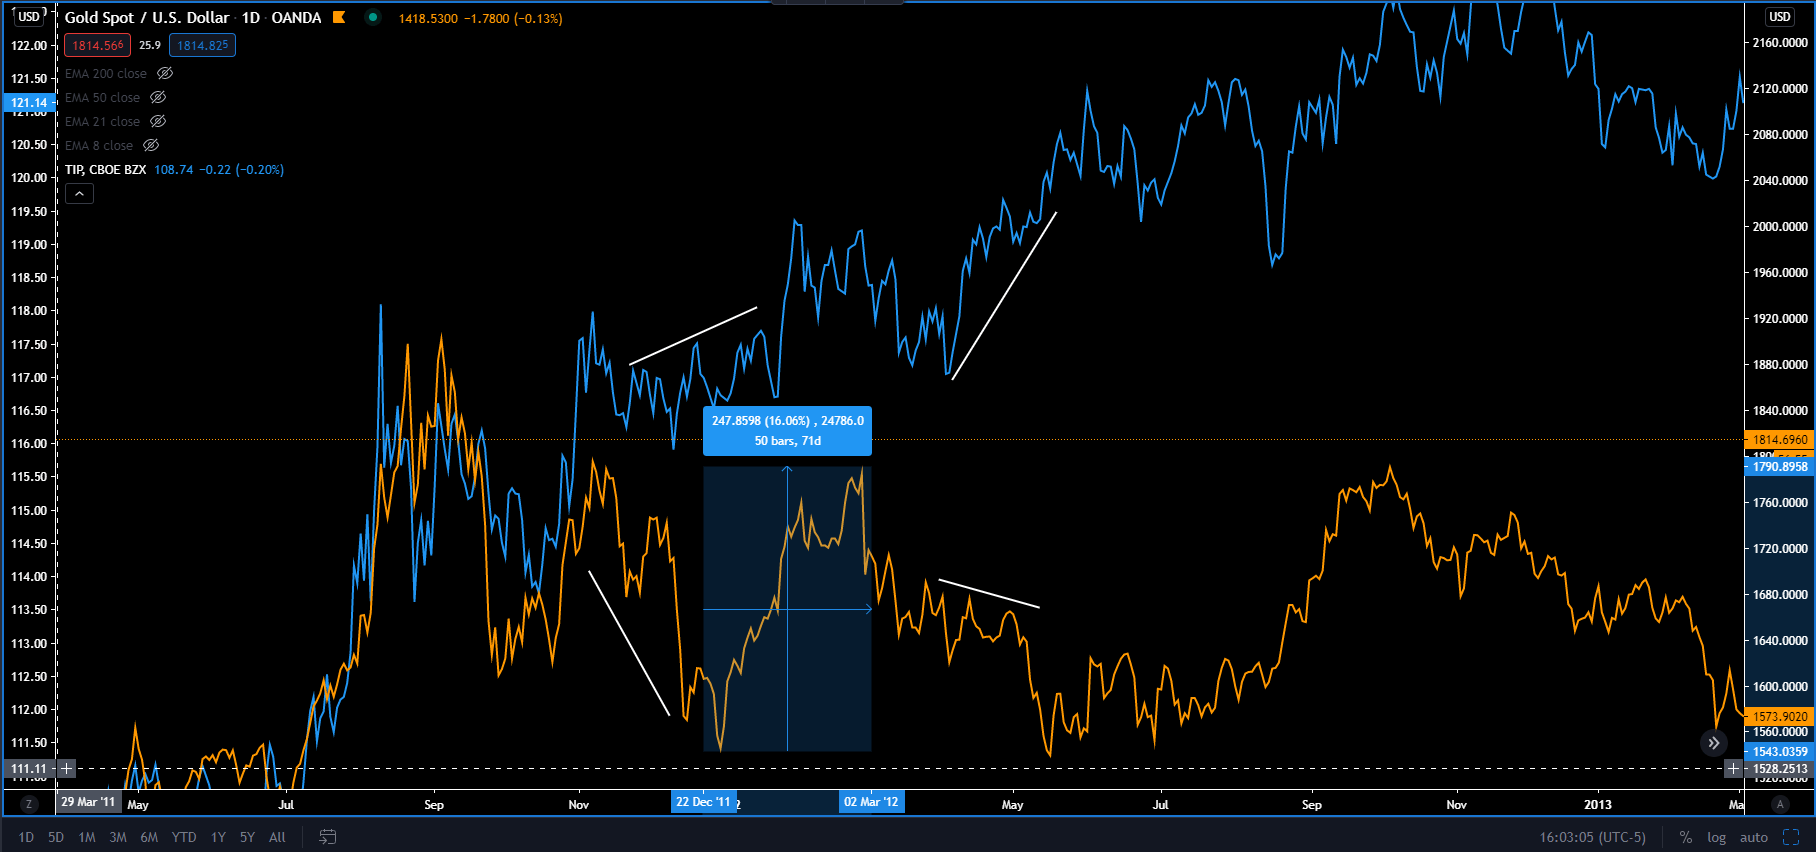
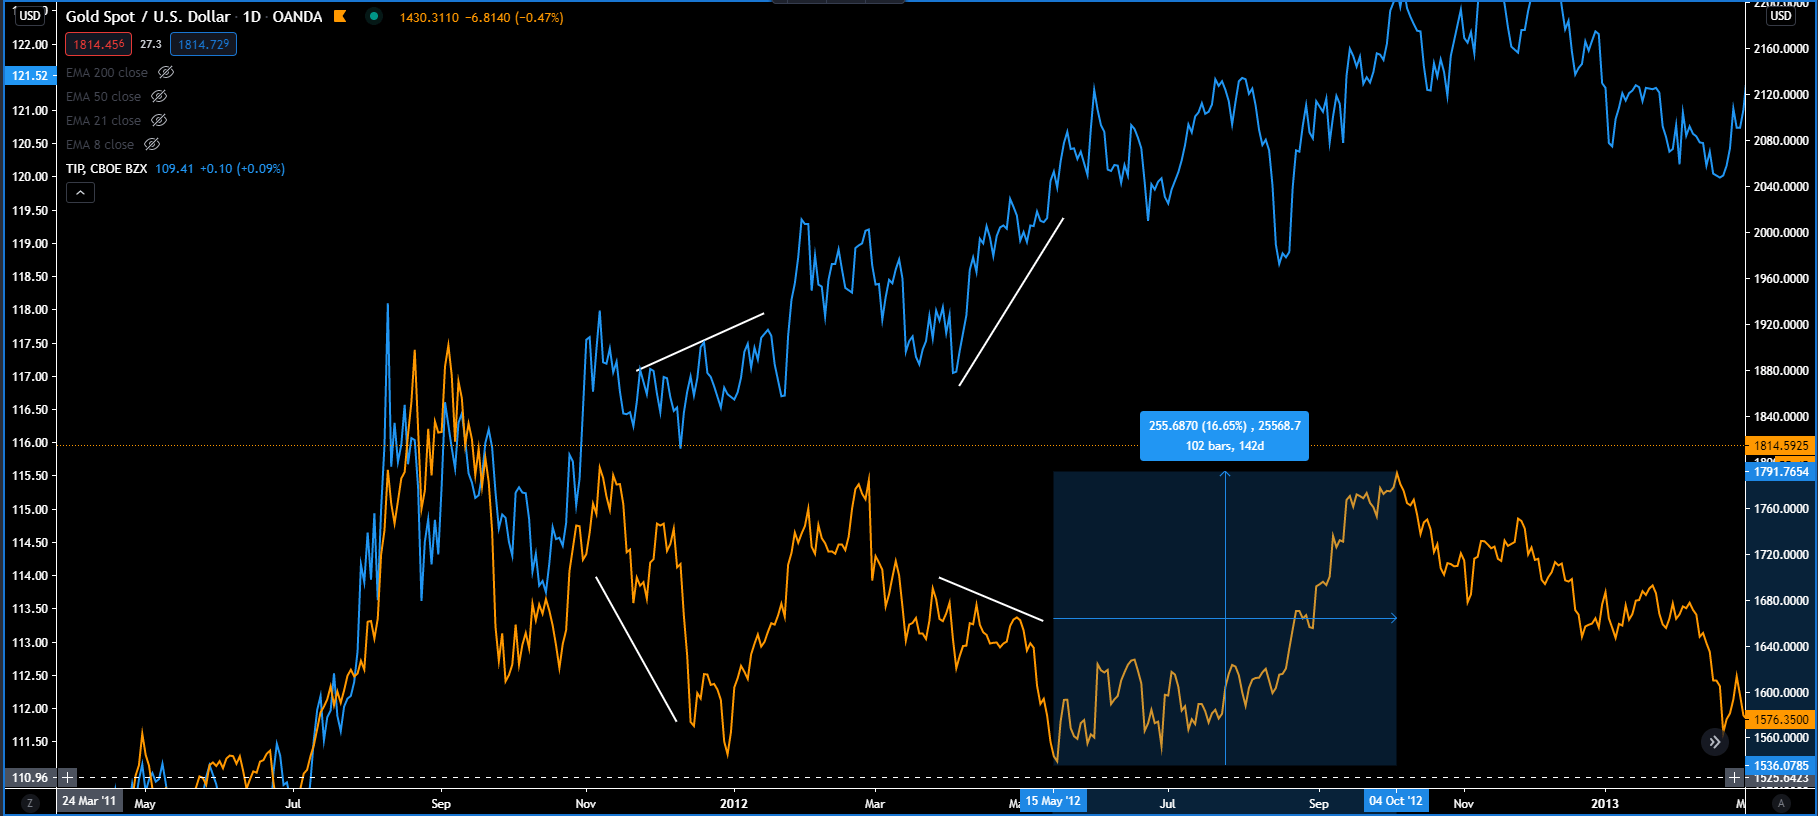
If we look below, we can see that in November 2011 the positive relationship between gold and TIPS broke down. TIPS rose (real rates falling) and gold fell, creating a negative divergence between gold and TIPS. Gold then bottomed a month later and rose about 16% over the next three months, reestablishing the positive correlation between gold and TIPS (inverse correlation between gold and real rates). The relationship broke down again just one month later (second chart), with TIPS rising (real rates falling) and gold falling. It didn’t take long for gold to find a bottom and rejoin TIPS to the upside with a 16% move over a five month span.
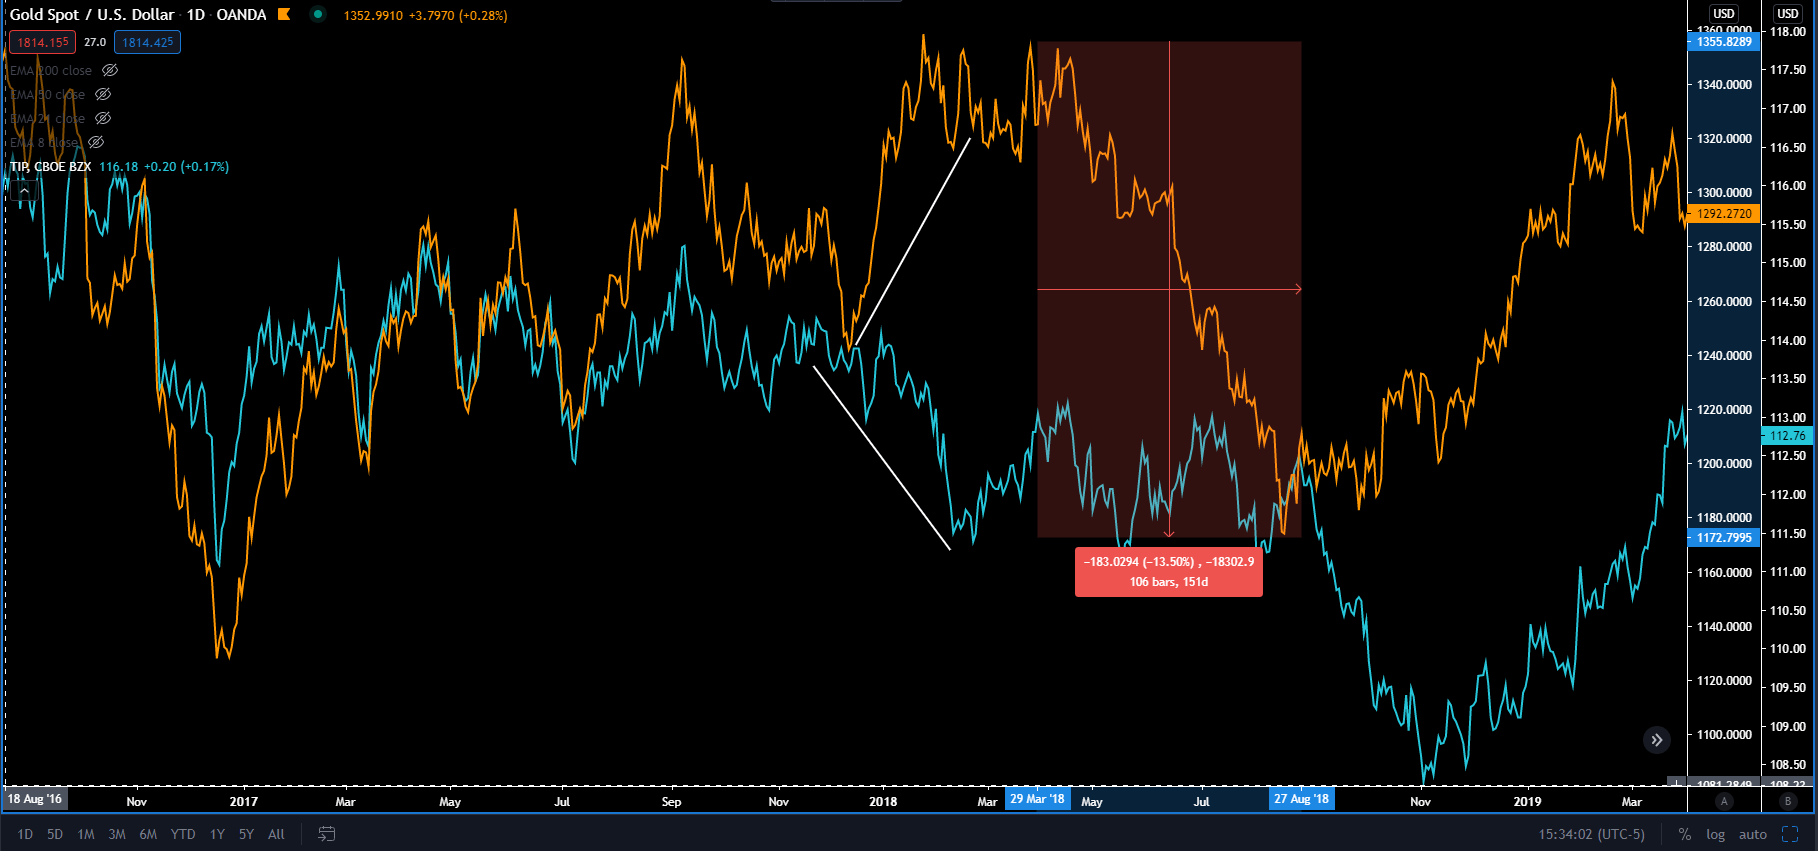
If we look (below) at December of 2017, TIPS started falling (real rates rising) while gold diverged the other way and increased in value. In mid-2018, gold peaked, then began a sharp decline, reestablishing the positive relationship with with TIPS, but this time to the downside. It was about a 14% move in four months time.
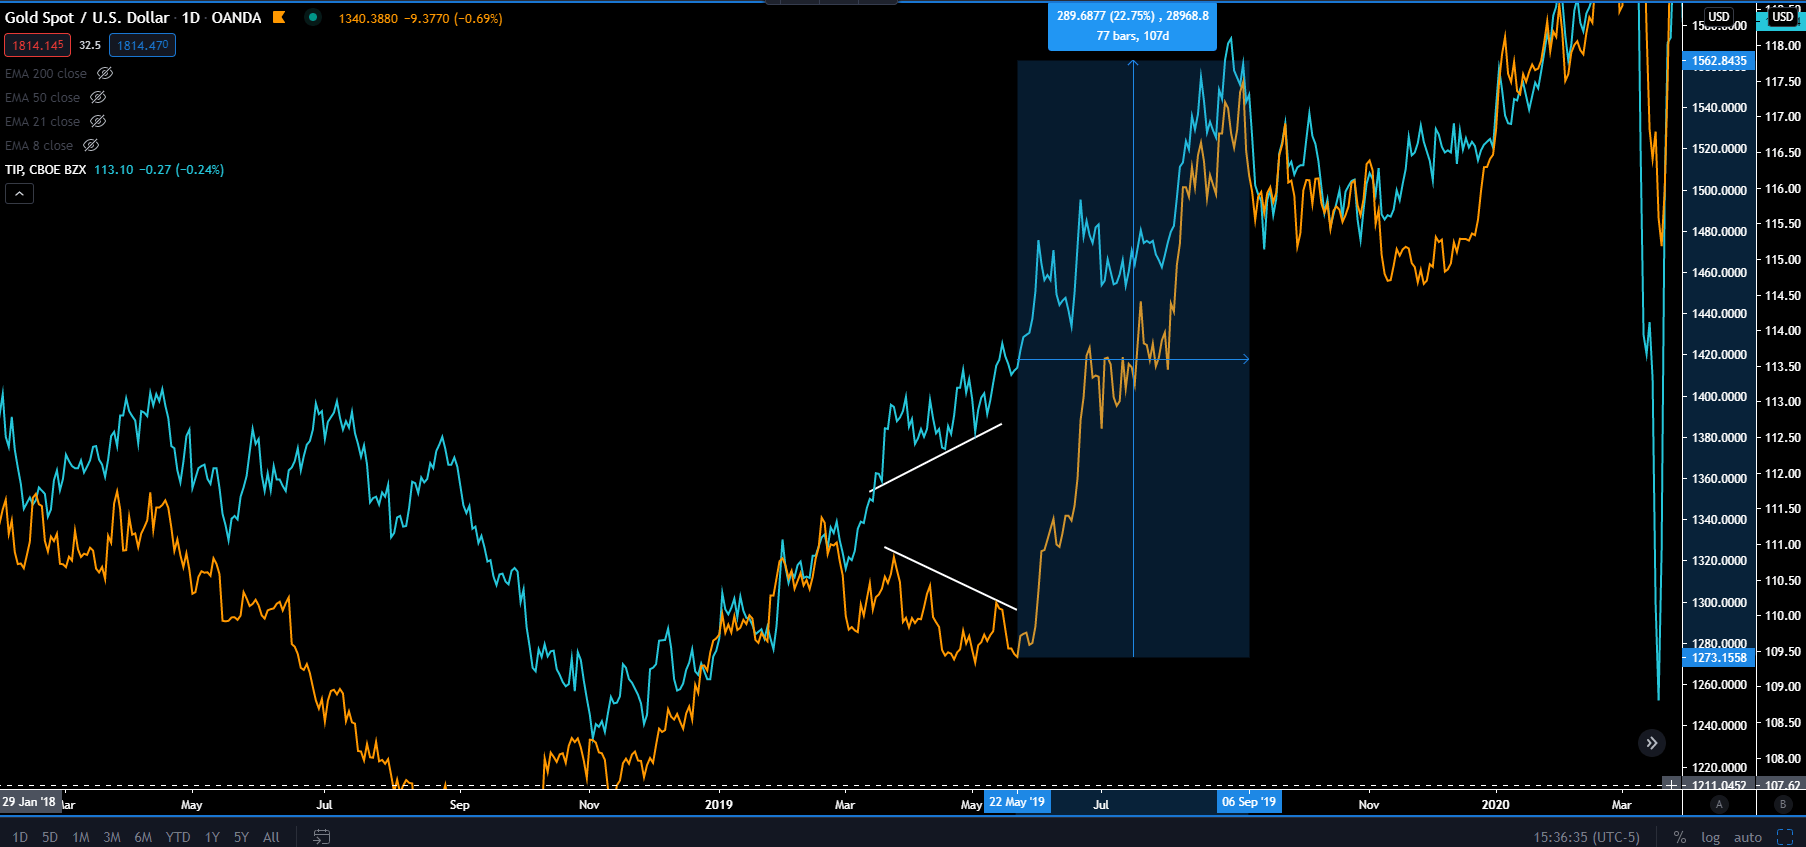
If we look (below) during early 2019, we can see the negative divergence between TIPS and gold. In February 2019, gold starting trading lower while TIPS was rising (signifying real yields were falling). That lasted a few months until May, when gold broke to the upside, reestablishing the positive correlation with TIPS (inverse correlation with real yields), with an explosive move up over 20% in the next four months.
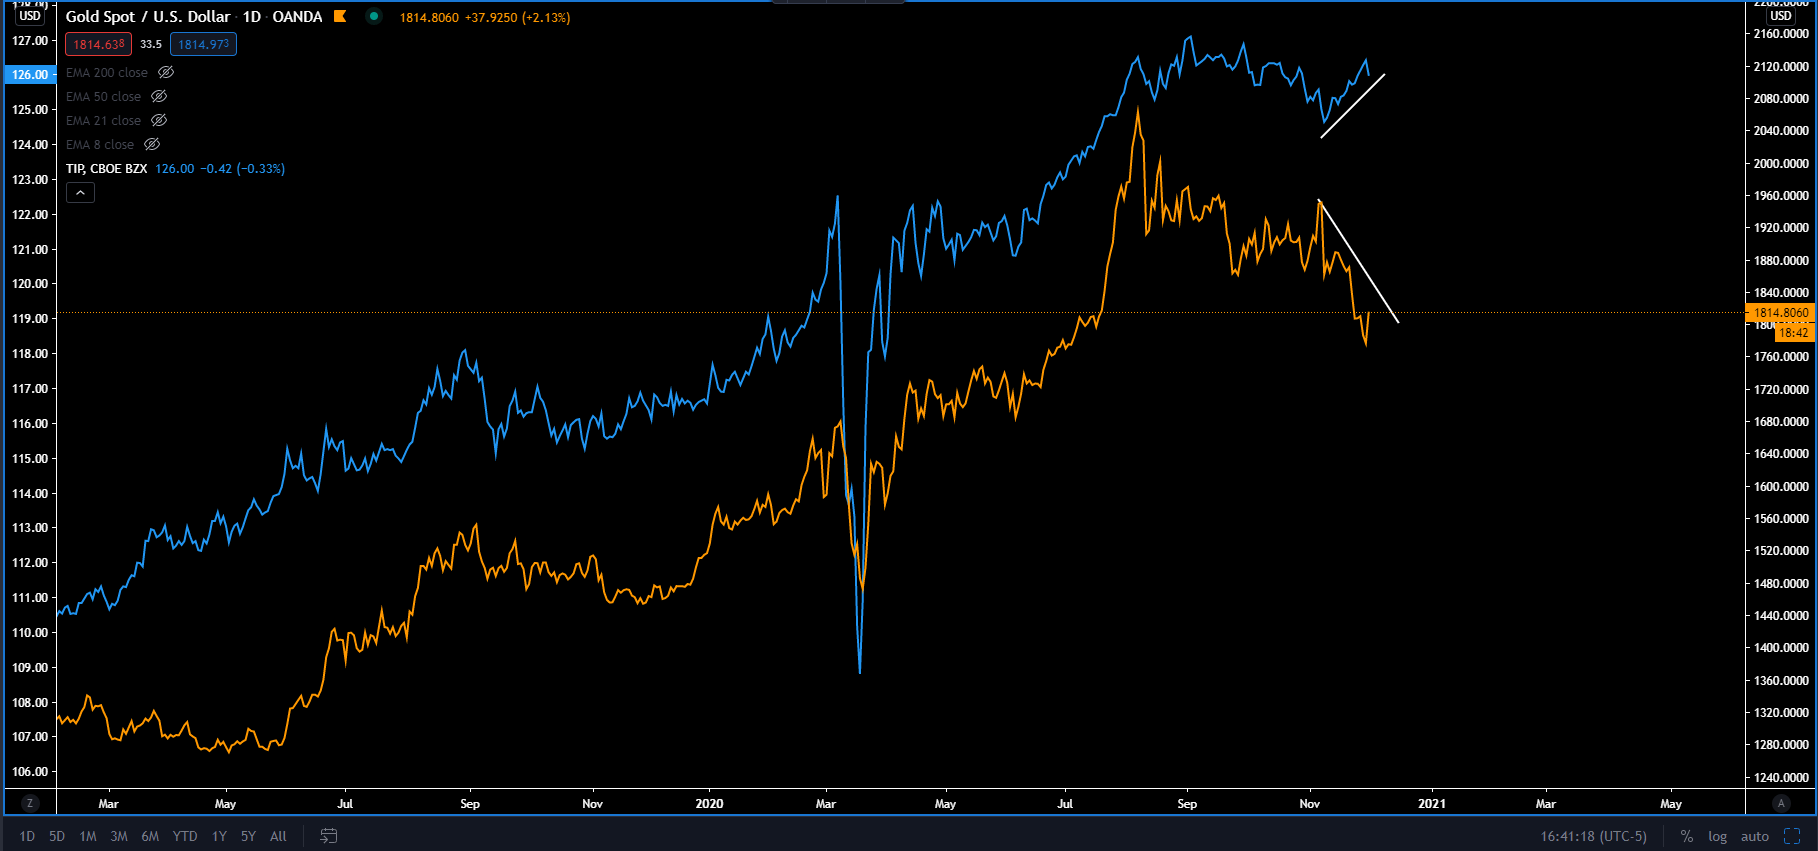
Now, here we are nearing the end of 2020 and TIPS and gold have once again negatively diverged from each other (below), meaning gold is falling alongside real rates. If recent history is any sort of indication, it means a gold rally to new all time highs may be in the near future. Now, I do not make any trading decision based on this or any one thing alone. But when you start to put together the pieces that are calling for higher gold prices, which I have talked about here and here, it becomes much more convincing that this recent weakness in gold is nothing more than a correction before rejoining its uptrend to higher prices.
Author

Ryan Miller
Ryan Miller Trading Economics
Ryan Miller received a Bachelors Degree in History from William Paterson University. Through his studies of U.S. history, he developed an interest in the implications the financial markets have on the economy.


