Stock market today: S&P 500, Dow Jones find support, tariff clouds linger
- The S&P 500 and Dow Jones experienced volatile trading due to ongoing tariff concerns, with initial losses followed by gains on EU counter-tariff news.
- Major tech stocks like NVIDIA, Amazon, and Meta Platforms saw gains, while Tesla and Apple struggled due to their China exposure.
- The Market Greed/Fear Index indicates significant fear among investors, but historical data suggests sharp market declines can be followed by strong recoveries. Is it to soon?
- Expect continued market volatility and whipsaw price action in the short term as tariff news develops.

Wall Street Indexes have seen a mixed bag today with wild swings from fresh lows to small gains at the time of writing. After starting the week in the red early in the session, the S&P 500 gained on news of a document which showed the EU has proposed counter tariffs on a range of US imports at 25%.
This is in response to US steel duties while also removing US bourbon from its list of goods to face counter tariffs. About 200 or so of the S&P 500 constituents are now either flat or in positive territory.
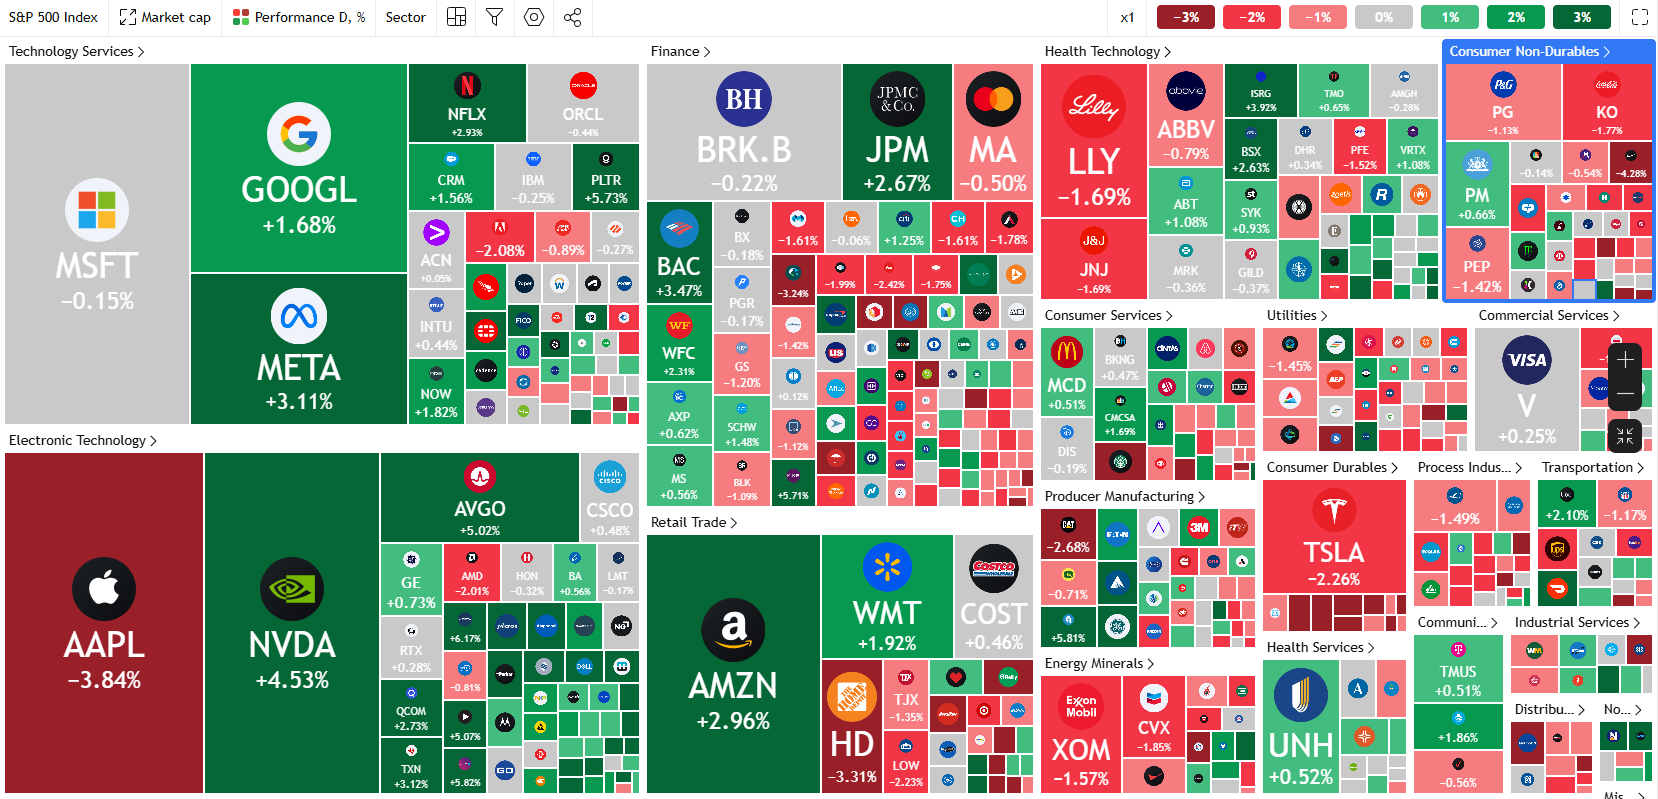
Source: TradingView
Among the notable heavyweights, NVIDIA is up 4.53%, Amazon is up 2.92% and Meta Platforms is trading 3% higher at the time of writing.
Tesla and Apple continue to feel the weight of further trade war developments due to their heavy exposure to China. The US-China situation continues to develop as earlier in the day U.S. President Donald Trump said he will impose an additional 50% tariff on China if Beijing does not withdraw its retaliatory tariffs on the United States.
Sentiment remains fragile but is there a case for optimism?
The Market Greed/Fear Index at 30.96 signals significant fear among investors, reflecting heightened concerns about a recession and economic damage from the ongoing trade war.
 ISABELNET (@ISABELNET_SA) _ X-638796520183127780.png)
Source: IsabelNet
There are also growing rumors and concerns of more US troops and military equipment heading to the Middle East which has stoked fears of an attack on Iran at a crucial time for global markets.
This begs the question, is there any reason for optimism?
Historical data may not always be 100% accurate in predicting future movements but they do provide us with valuable insights. With that in mind, a 10% drop in the S&P 500 over two days is unusual, but history shows that sharp declines are often followed by strong recoveries, giving investors reason for optimism.
As you can see from the chart below such movements are usually followed by strong performance in the days and weeks ahead.
 _ X-638796520482898388.png)
Source: IsabelNet
Will history repeat itself or is it too early to tell?
What can we expect moving forward?
There does seem to be a lot of conflicting views as to how markets may shape up tomorrow and the days ahead. However, if there is one thing that seems certain it is volatility.
In the short-term I expect more wild price swings as news and developments around tariffs filter through. Traditional trend trading may prove extremely difficult in the days ahead given the sharp decline and selloff last week.
A bounce cannot be ruled out as evidenced by today's move but dynamics are shifting so quickly that sustainability of such moves are likely to prove challenging.
Technical Analysis - Dow Jones (DJIA)
From a technical standpoint, the Dow Jones opened with a gap to the downside something which we saw across a host of markets.
The recent recovery on Wall Street Indexes has seen the Dow close the gap and record some gains before sellers returned. At the time of writing, the Dow Jones is trading 0.57% down for the day.
The 14-period RSI on a daily timeframe remains in extremely oversold territory which means a bounce remains very much in play.
Immediate resistance rests at 38256 before the 39000 handle and the psychological 40000 come into focus.
On the downside support has been found at 36600 with the next areas of support at 35700 and 35000.
Dow Jones (US30) Daily Chart, April 7, 2025
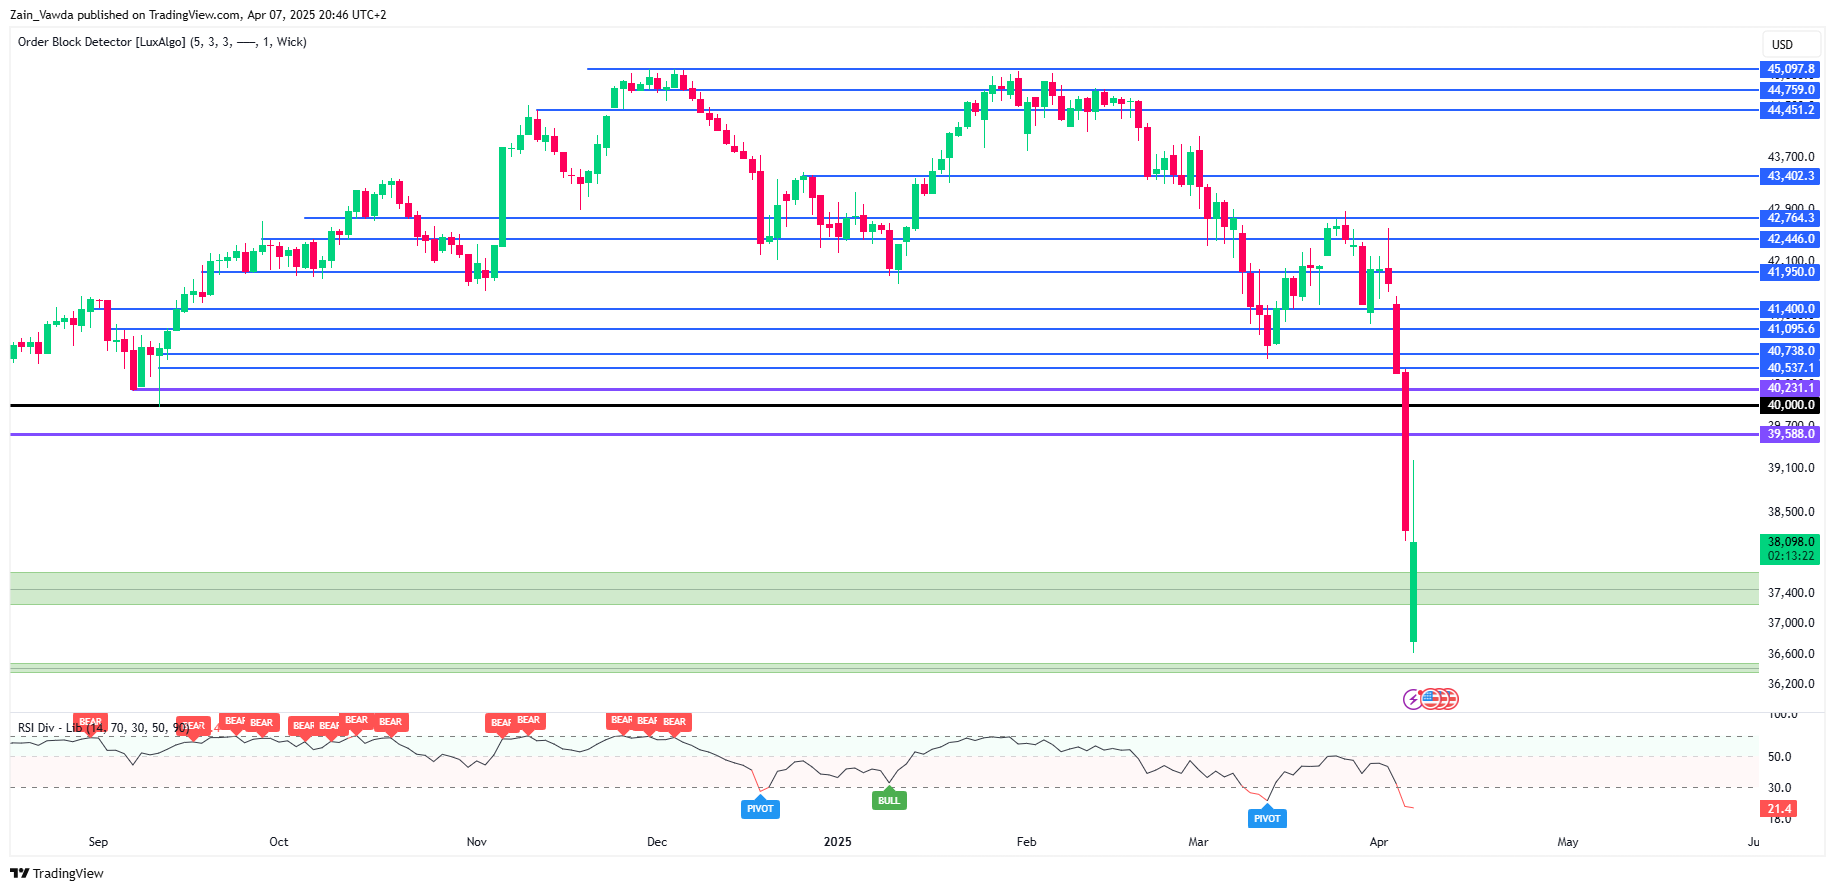
Source: TradingView (click to enlarge)
Support
- 36600
- 35700
- 35000
Resistance
- 38256
- 39000
- 40000
Author

Zain Vawda
MarketPulse
Zain is a seasoned financial markets analyst and educator with expertise in retail forex, economics, and market analysis.


