Gold and Palladium Shake Hands

The price of palladium just exceeded the price of gold for the first time in 16 years. That's an epic even. But what does it really mean? And why should gold, silver, and mining stock investors care about the small palladium market?
In short, because this development can tell us something about the future performance of the PM sector in general.
The last time the gold to palladium ratio was trading below 1, meaning that palladium was worth more than gold, was in late 2002. The ratio stayed there for a few months before finally rallying above it, which suggests that investors may need to see both metals at similar price levels before they accept that palladium can really be worth more than gold. The 2002 example, however, shows that the 1 level works as resistance for the ratio, and in the current case it's critical to check if it works as support.
And it does. Not with perfect precision, but it's definitely useful. Back in 1998, when the ratio was breaking below 1, it moved back and forth around this level for several months, and declined below this important level only after this consolidation was completed.
What does it imply for the current situation? It indicates that palladium's march higher may stop for a while. Moreover, if gold declines in the following weeks, it may decline as well in order to keep the ratio close to 1.
The key question that you are probably asking yourself is why does this small market (the size of the palladium market is tiny compared to the one of gold) matter for those, who are interested in gold, silver, and mining stocks, not only in palladium. The reply is that, when approached carefully, palladium's link to gold can serve as a technical signal.
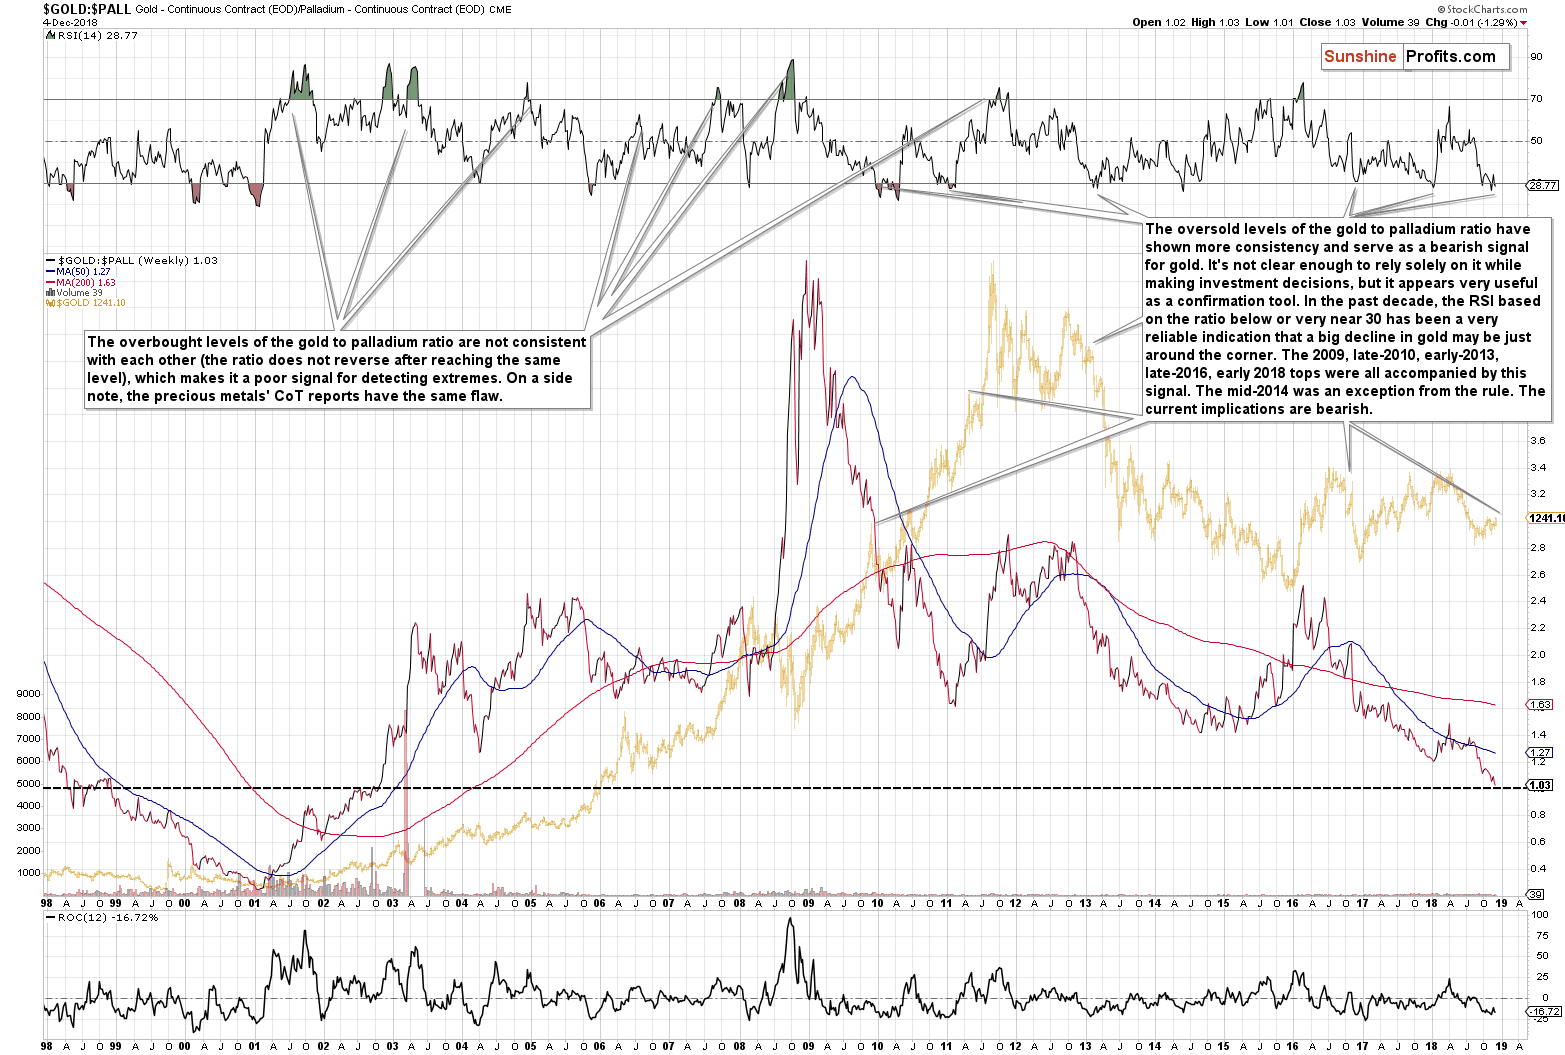
The gold to palladium ratio by itself is not range-bound. It moves extremes that are not necessarily consistent over time and because of that it's not really useful on its own. However, applying an indicator that would transform the ratio movement into something that's more range-bound can provide us with more valuable information. We'll use the RSI indicator, which you can see in the upper part of the above chart.
Let's start with the limitation of the above approach. Even in case of the RSI indicator, the overbought levels of the gold to palladium ratio are not consistent with each other (the ratio does not reverse after reaching the same level), which makes it a poor signal for detecting extremes. On a side note, the gold and silver CoT reports have the same flaw.
Fortunately, there is a way to use the above after all. The oversold levels of the gold to palladium ratio have shown more consistency and serve as a bearish signal for gold. It's not clear enough to rely solely on it while making investment decisions, but it appears very useful as a confirmation tool. In the past decade, the RSI based on the ratio below or very near 30 has been a very reliable indication that a big decline in gold may be just around the corner. The 2009, late-2010, early-2013, late-2016, early 2018 tops were all accompanied by this signal. The mid-2014 was an exception from the rule.
Since almost all cases form the past decade when the RSI based on the gold to palladium ratio moved very close to or below 30 meant that huge declines in gold are close, then we can view it as a very bearish signal. This is especially the case that it's not a single bearish factor that's currently in place. Conversely, there's been a number of factors pointing to a big decline in the prices of gold, silver and mining stocks in the following weeks. Consequently, the above-mentioned bearish signal serves as their confirmation.
From the gold & silver portfolio management point of view, it may be tempting to focus on palladium as it's been performing so well lately. However, the long-term outlook is not as rosy as it seems. We explained it in the part 5 of our Preparing for the Bottom series, entitled What to Buy, and it seems that in light of what's happening in palladium prices right now, it's worth quoting this analysis:
Well, it's potential seems more promising than the one of platinum (and the platinum to palladium ratio has been declining accordingly), but it's still likely to suffer due to the same fundamental reasons in the coming years. Almost 85% of demand for palladium comes from the automotive industry (it's used instead of platinum in the case of the gasoline-powered cars), which makes it effectively an industrial metal, more similar to copper than to gold. So, should it really be a part of a precious metals portfolio? It could, if it had a promising outlook and this also seems to be a problem. While it's likely to outperform platinum (just as gasoline cars are taking over diesel cars), it has a major problem in the form of the long-term rise of the electric car market share. These cars will not dominate the market shortly, but the trend is already present and since markets are generally forward-looking, the prices could reflect this trend much sooner, which doesn't bode well for the prices of palladium in the following years (at least compared to gold and silver). Some might say that fuel cells will support the demand for platinum and palladium, but that doesn't seem to be the case.
From a technical point of view, we see that palladium has been outperforming the precious metals sector for a few years, but the 2000 – 2009 performance was very weak. The biggest run-up – in addition to the current one – was seen right after the 2008 bottom ($160.30) when palladium rallied to $862 in 2011 (rallying by almost 438%). For comparison, silver soared from $8.40 to $49.83 (rallying by over 493%) – the latter still outperformed.
So, when did palladium exactly outperform? When the precious metals sector – in general – was declining. It's no wonder that this happened – after all, the general stock market has been soaring and the vast majority of demand for palladium is of industrial nature.
Since we want to enter the precious metals market and exit it close to the top, then it's the performance during upswings that is most important, but one can say that the above is at least "interesting" about palladium.
What's less interesting is palladium's performance in the previous great bull market that we saw 4 decades ago. Palladium rose from below $40 to about $350, while gold moved from below $40 to about $850 and silver moved from below $1.50 to about $50. Palladium was a clear loser in that race and since history tends to rhyme, it doesn't make us thrilled about palladium's future performance.
All in all, even though the price is currently well above the palladium production cost, this precious metals doesn't seem to be a long-term winner. Its fundamental picture and the analogy to the previous great bull market make us reluctant to include it in the long-term investment category of the precious metals portfolio. There are better ways to gain the edge over other investors than through adding palladium to one's investment portfolio.
Summing up, the outlook for the precious metals market remains very bearish for the following weeks and. The strongly bearish analogies to 2013 and 1999, miners' underperformance, the number of intraday reversals in the GLD ETF, the triangle-based reversals in gold and silver, the outlook for the USD Index as well as the situation in the gold to palladium ratio are only several of multiple reasons pointing to much lower precious metals' prices in the near future.
Want free follow-ups to the above article and details not available to 99%+ investors? Sign up to our free newsletter today!
Author

Paul Rejczak
Sunshine Profits
Paul Rejczak is a stock market strategist who has been known for the quality of his technical and fundamental analysis since the late nineties.


