Global growth through the lens of FX

Real economic growth peaked in Q2 of this year, which can be witnessed simply by viewing the decelerating economic data in employment, consumption, industrial production, and income. China’s economy began contracting prior to the US; however, the US economy is now following suit (seems to be the trend since 2008). Without the two biggest economies in the world, global economic growth is an impossibility. In this article, I am going to look through the lens of FX (foreign exchange), as confirmation of the global economic slowdown. The reason being is that FX is one of the most forward-looking markets. So, if FX is telling us a slowdown in growth is here, we need to listen.
I am going to analyze a couple of commodity currencies (nations that are heavily reliant on their export sector), particularly the CAD (Canadian dollar) and AUD (Australian dollar). As exporting nations, when global trade is flowing, Canada and Australia receive inflows of capital which appreciates their currencies. When trade, and thus growth, slows, the capital inflows slow down (can be seen as outflows), depreciating their currencies. If you look below, I have the CAD and AUD paired against the USD. The CAD and the USD have an inversed relationship— just to better see the positive relationship the CAD and AUD have with each other. As you can see, the AUD/USD peaked in February 2021, proceeding the peak in economic growth of Q2 2021. The CAD/USD peaked later in May 2021. The CAD remained stronger for longer on the back of rising prices in the energy sector (oil is Canada’s largest export). But, since the peak, the CAD and AUD are now down against the USD, 6.5% and 9.5% respectively. These moves to the downside coincide with the slowdown in growth.
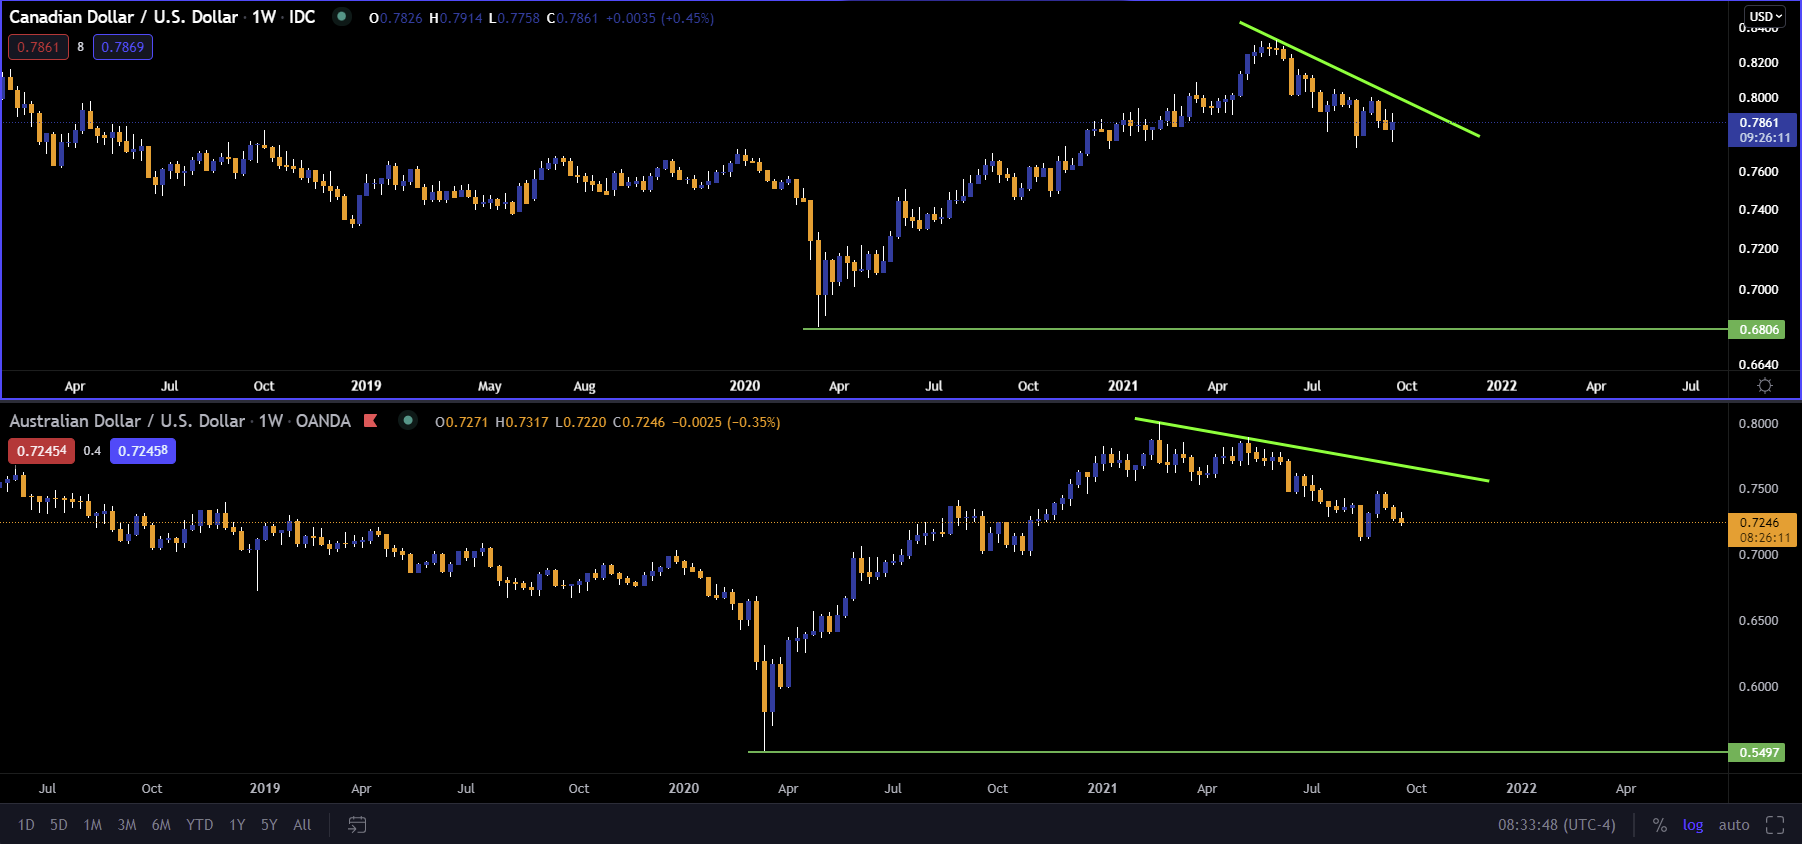
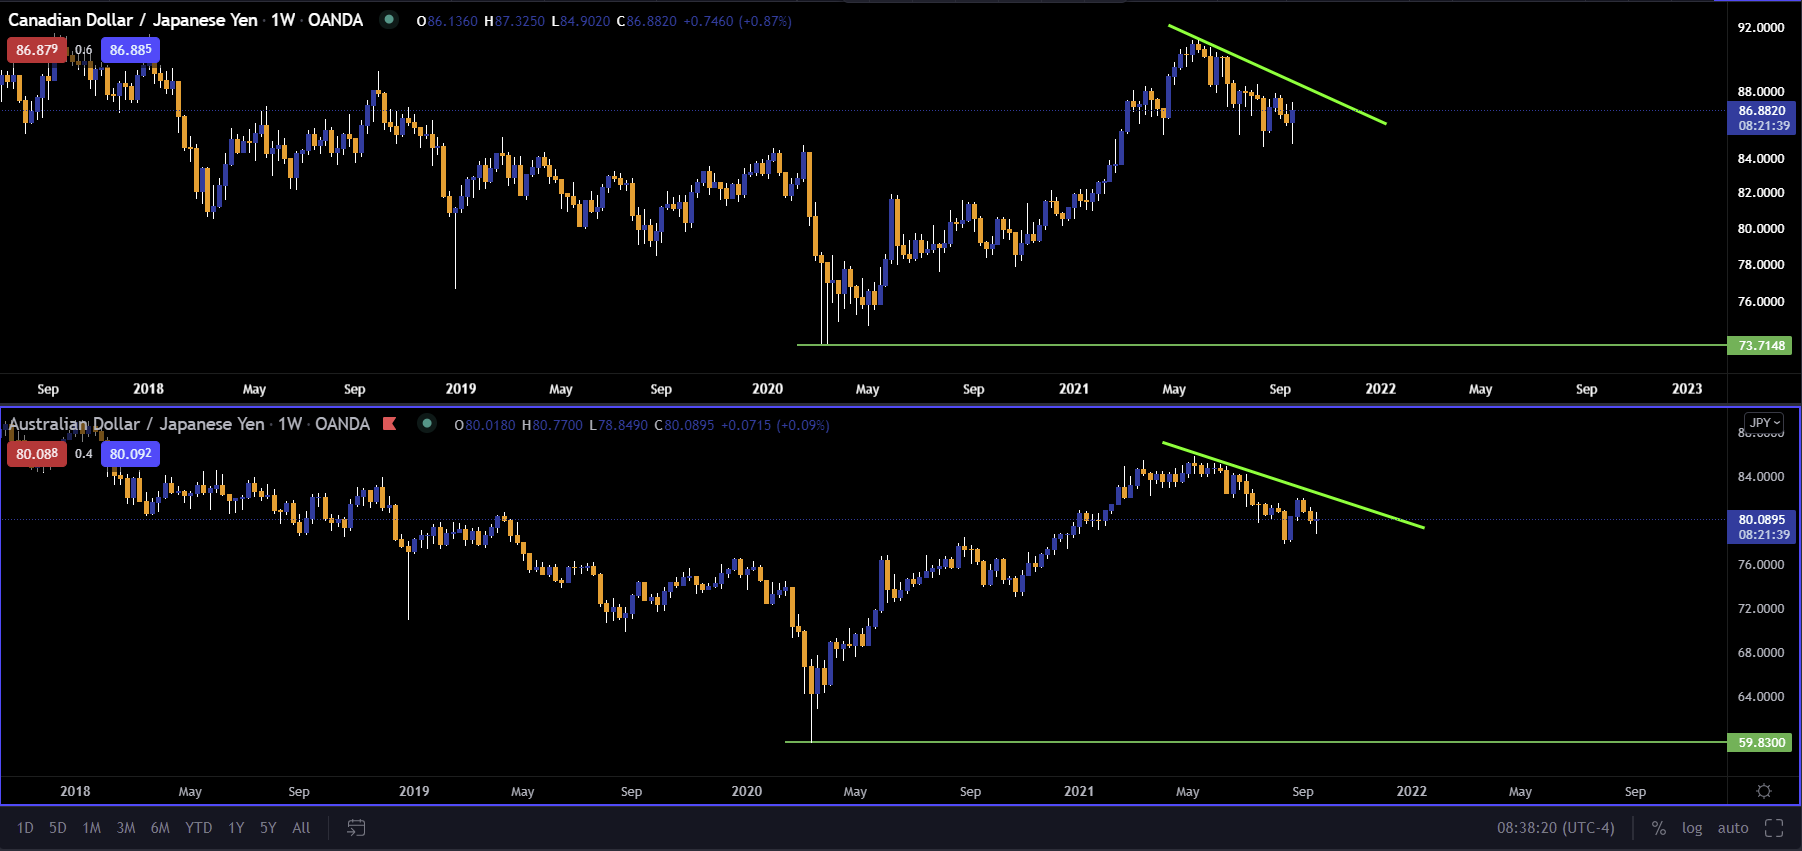
If economic recovery, and thus, economic growth is going to continue, these currencies should be outperforming the USD. If we look again at those two charts (above), we can see that the bottom in the CAD and AUD versus the USD was in March 2020, which preceded the reflationary, cyclical upturn in the economy that began in May of 2020. However, that is no longer happening. The same holds true if you pair the CAD and AUD versus the JPY (Japanese yen), which is a pure risk on/off currency (falls during periods of confidence and rises during periods of uncertainty). When the world is experiencing growth and stability, currencies, particularly commodity currencies, will move higher against the JPY. If you look below, I have paired the CAD/JPY and the AUD/JPY and you see that’s exactly what happened from the post March 2020 selloff and into 2021. However, the CAD and AUD have both peaked against the JPY and have rolled-over, similar to their reaction against the USD. Both the AUD and CAD are down roughly 6.5% against the JPY, from their peaks in May. Again, this coincides with the peak in real economic growth in Q2 of 2021.
Now, let’s look at the USD and how it affects global economic growth. The global monetary system functions far better when the dollar is weak or weakening. Global commodities are priced in dollars– if the dollar is falling, it makes purchasing commodities much cheaper, which encourages global trade. A lot of emerging market (EM) economies are rich in natural resources and benefit from a cheaper dollar, not only because of trade, but because EM nations take on a lot of USD-denominated debt. If the dollar is strengthening, it makes it more expensive for EM’s to service their USD debt, which leads to less economic investment. Also, about 40% of global debt is denominated in USD, and again, a cheaper dollar frees up more cash for investment and trade. Because of this, when the dollar is up, global GDP tends to fall and vice versa. In monetary terms, a falling dollar is associated with loose or loosening money conditions, whereas a rising dollar is associated with tight or tightening money conditions. The former can be seen in periods of growth and reflation, while the latter can be seen in periods of contraction or crisis.
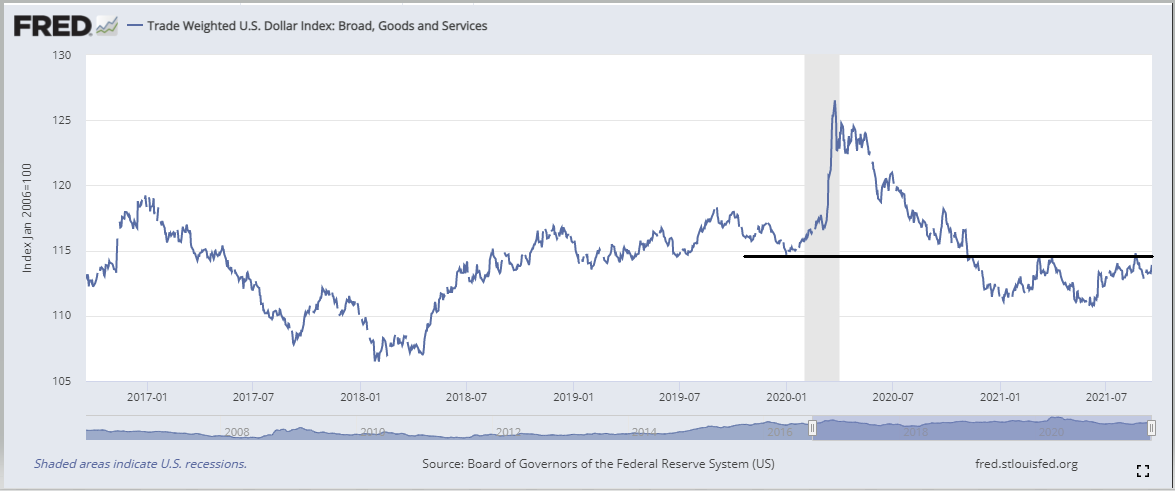
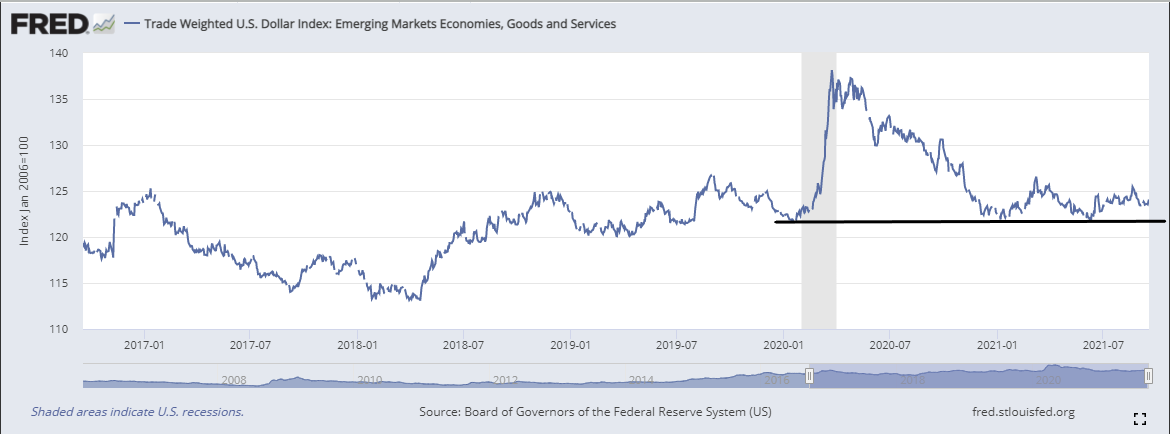
If you look below, I have two charts, the Trade Weighted US Dollar Index against a broad basket of major currencies and the Trade Weighted US Dollar Index against Emerging Market currencies. Both indices bottomed in January 2021, proceeding the peak in economic growth. The last move higher in the dollar took place from January 2020 until March 2020. If you look closer at the dollar against EM’s, you can see that the dollar has never broken below the low from January 2020, whereas the dollar index against major currencies has. From a long-term technical perspective, the failure to break below the low (pivot) from January 2020 shows that the bulls are still in control. This is important, because EM’s are so vital to global growth and take on a lot of USD-denominated debt, and therefore are more sensitive (vulnerable) to moves in the dollar. The fact that many EM currencies have not recovered (which you’ll see in a moment) against the USD not only speaks to the global dollar shortage but the reason why economic recovery was never a real possibility. It’s importantote, these are not mutually exclusive ideas— failed economic recovery is a symptom of the global dollar shortage (more on this in an upcoming article).
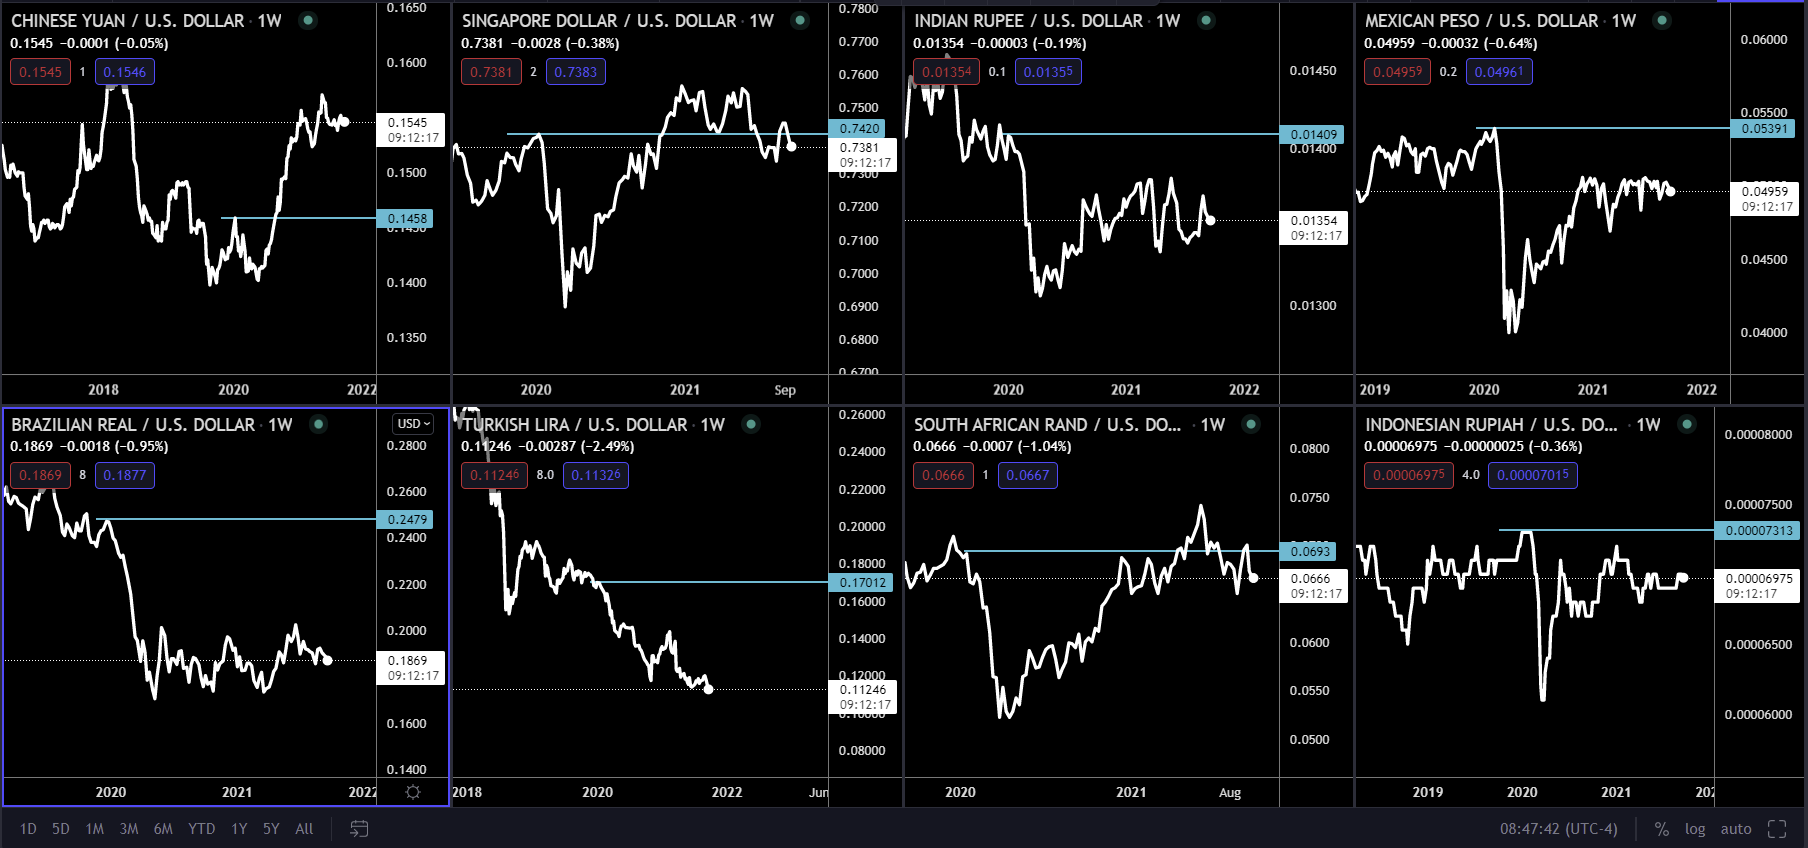
If you look below, you can see a chart of some of the biggest EM currencies and their performance against the USD over the last 18 months or so. Aside from the Chinese yuan, every other currency has failed to move above the high (blue line) formed from January 2020, which was just prior to the Covid recession (Singapore dollar and South African rand did move briefly above but are now back below).
When you look at FX, especially through the lens of EM currencies against the USD and more recently commodity currencies against the USD, it paints a much different story than the one currently being written about in the mainstream - the world is flush with dollars. If this was truly the case, economic recovery would be a reality and it would be reflected in the exchange rates, especially those of EM currencies against the USD. When dollars are flowing globally (loose or loosening money conditions), the dollar falls, trade picks up, and reflation occurs. When dollars are not flowing globally (tight or tightening money conditions), the dollar rises, trade slows, and growth contracts. The fact that global dollar flows are not being reflected in the FX market, tells us that growth has peaked (combined with decelerating economic data is confirmation of this) and the potential for disinflationary forces to take over again are mounting. If you’re an investor, you should be, or should already have shifted the weight of your portfolio to a more defensive stance– reducing your exposure to cyclical (reflationary) assets like industrials, financials, energy, EM’s, international equities, high yield bonds, industrial commodities, commodity currencies, etc. and increasing your exposure to more defensive assets, such as, utilities, health care, consumer staples, real estate, Treasury bonds (long duration), cash, gold, Japanese yen, US dollar, and the like. Defensive sectors will generally outperform cyclical assets over the next several months as growth slows.
Author

Ryan Miller
Ryan Miller Trading Economics
Ryan Miller received a Bachelors Degree in History from William Paterson University. Through his studies of U.S. history, he developed an interest in the implications the financial markets have on the economy.


