The US labor market and age demographics are deflationary

The “V” shaped recovery is one that has been ranted about since the Covid pandemic struck and we saw a selloff in risk assets back in March, but that narrative has been fading recently. Although, the S&P 500 and the Nasdaq have not only recovered but continue to create new all-time highs in the process! Why should people be talking about a recovery that is anything but a V? Well, for starters, the Labor Market suggests that not only is a V recovery not happening, but it may very well be an inverse V (or an M if you’re a technical trader) headed back towards the March lows.
The Unemployment Rate in the US continues to drop off of its peak of 14.7% in April to under 7% as of November. Surely, as the economy has been reopened for several months, this indicates people who were laid off due to Covid are now getting back into the workforce and the economic recovery is right on track. But, what about the Labor Force Participation Rate? As you can see in the chart below the participation rate’s recovery has seemingly peeked in August and has now stalled. There was a 0.3% drop in the participation rate from August to September, or about 700,000 workers. To put that into perspective, the labor force back during the Global Financial Crisis saw its worst month on record in December 2009, losing 769,000 workers. September 2020 would have been the second worst month for the participation rate during the GFC, yet here we are in the midst of a recovery? What this indicates is that the drop in unemployment has been due to the amount of workers exiting the workforce, NOT reentering the workforce. Since September, the participation rate’s recovery has completely stalled and is now threatening to roll back over.
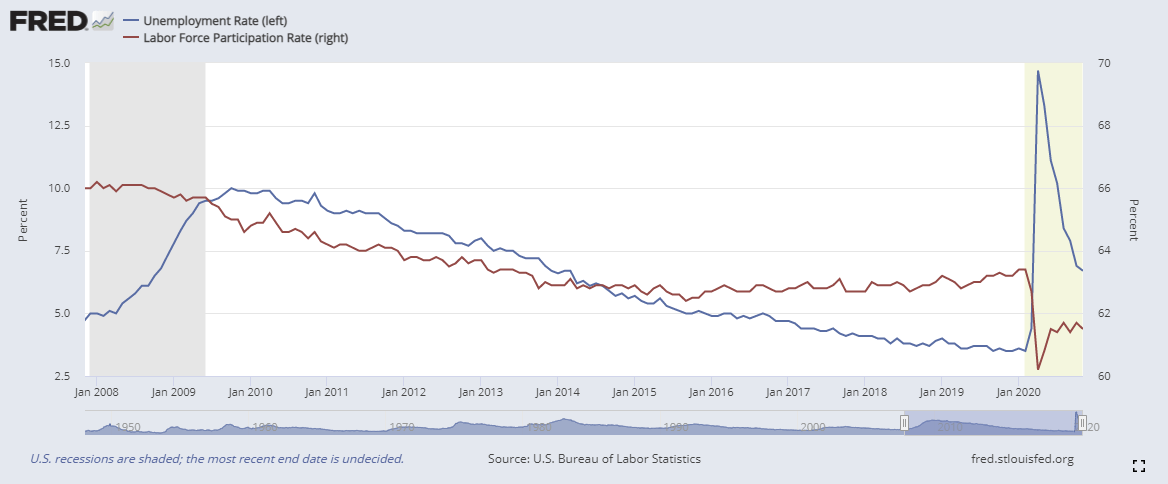
Why are so many Americans exiting the labor force during a time that is supposed to be a recovery? Perhaps they do not believe the recovery is happening or is going to happen anytime soon. After all, this is not their first rodeo. If we take a look back (chart below) at 2008, you can see this is when the labor force had its back broken, as the decline in the participation rate sharpened. Just before the GFC was the last time we saw a tight labor market – low unemployment and high participation rate. You can even see that the labor force peaked in 2000 (just prior to the Dotcom bubble’s burst) and has been slowing down ever since. But, the GFC is when things really fell apart and the labor market has yet to recover.
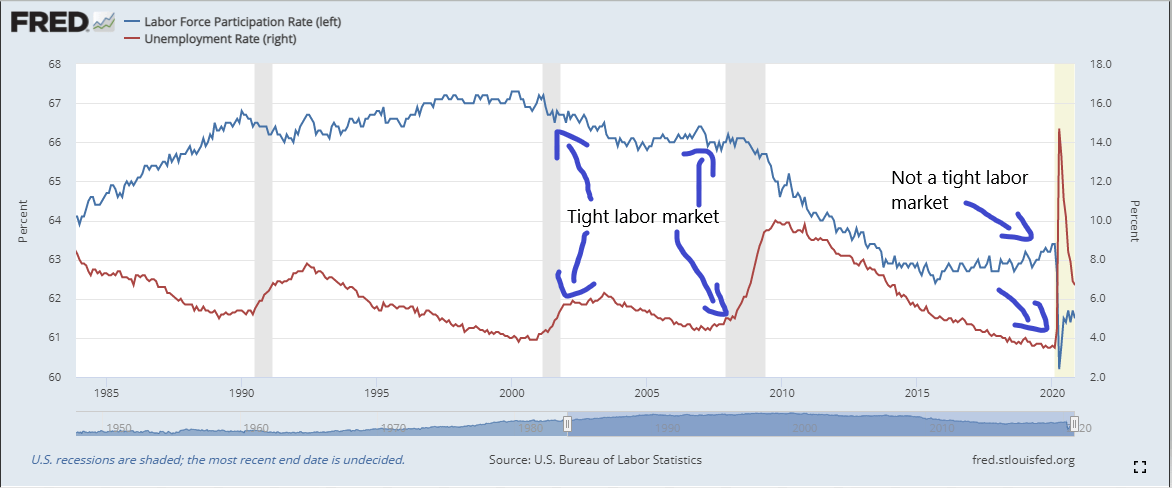
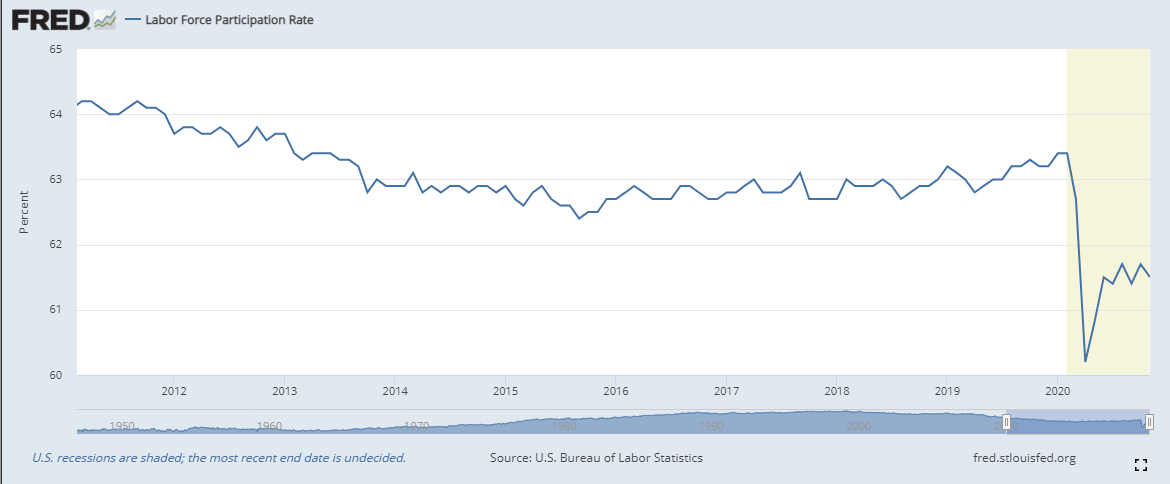
If you take a look (below, first chart) at the participation rate by itself, you can see the 2020 peak was in February. Since the pandemic struck, the participation rate’s “recovery” has barely made it halfway back to the level it was at prior to the pandemic. It has now stalled and is looking like it wants to rollover to the downside. Yet, the falling unemployment rate is the one that grabs the media’s attention, creating the false narrative that things are better than reality. The unemployment rate can be a very misleading number. Just ask the Fed. They viewed the low unemployment rate as a “tight” labor market back in 2018 despite the participation rate saying otherwise. This “tight” labor market was a main factor in the Fed’s decision to raise rates twice at the end of 2018, because they thought the tightness in the labor market would create runaway inflation. The result? The stock market corrected by about 20% and inflation never materialized. The unemployment rate (like all data) needs to be put into context, not taken at face value.
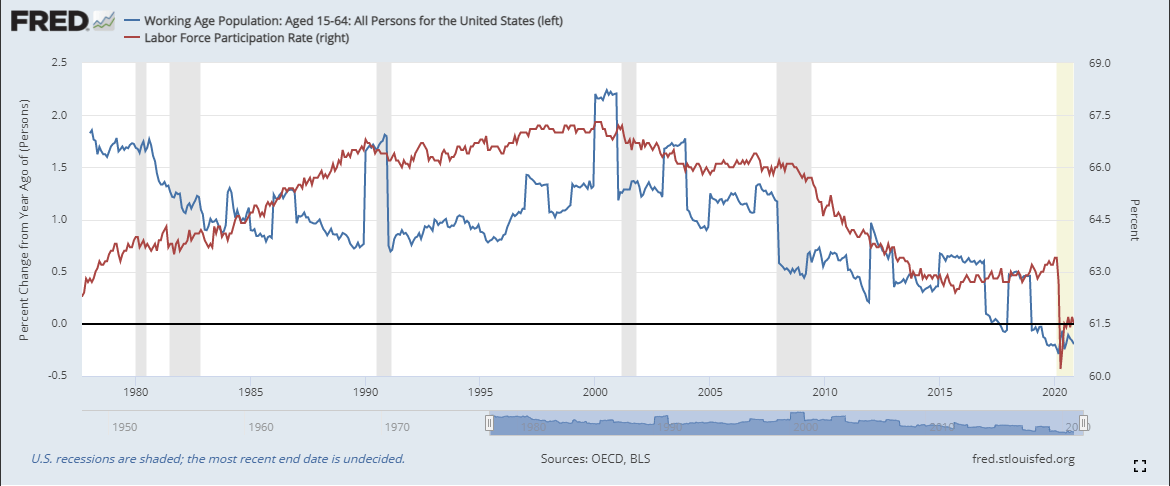
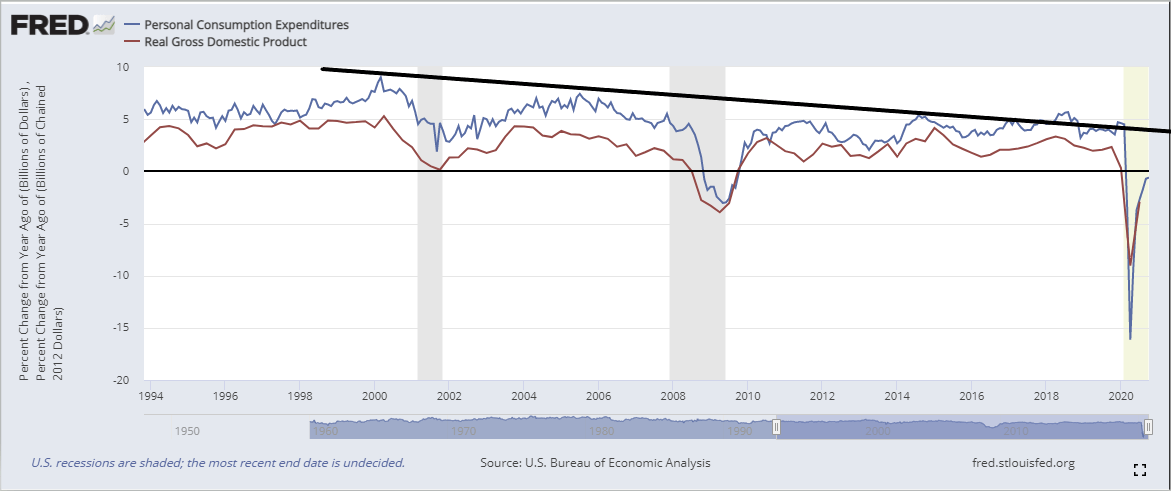
Now, one could argue that the declining participation rate in the US has been due to an aging demographics. This is certainly true from a long-term view, but on a more month-to-month basis, it does not excuse the failed attempt at recovery. But, let’s stick with the aging demographics for a second, because this is a major piece to the overall puzzle. If we look (below), I have the labor force participation rate alongside the working age population on a year-over-year basis. As we can see the peak for both happened just prior to 2000. About 17% of the US population is over the age of 65 and that percentage is only going to increase over the next few decades. An aging demographic is a major deflationary force for an economy. Typically, spending peaks in the middle age years for most people, because they are raising a family. As they get older, they often downsize and spend less. Less spending by consumers is negative for growth. If you look at the 2nd chart, you see the positive relationship between consumer spending and real GDP. Like the participation rate and age demographics, consumer spending and real GDP on a year-over-year basis have been on a decline for the last 20 years. This has all been occurring on a large scale, as you can see by the steady decline in the participation rate, age demographics, consumer spending, and real GDP over the last 20 years.
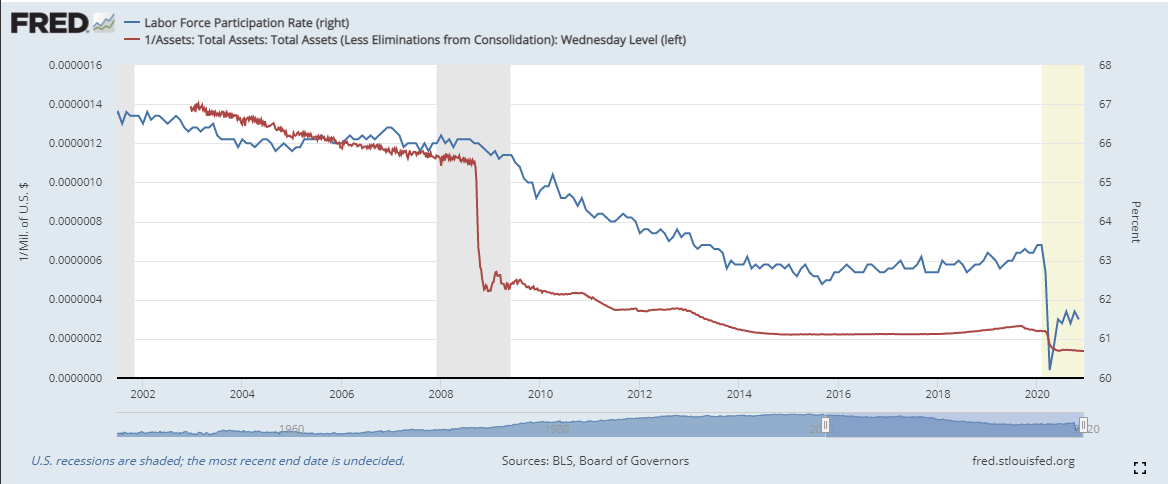
Another theme recently that has been receiving massive attention is the Fed’s balance sheet. The Fed’s balance sheet expansion has accelerated at a record pace in 2020. Many view this as the reason we will get high levels of inflation in 2021. But, if there are major deflationary forces at play, like the ones we just talked about (among many others), then perhaps the Fed’s balance sheet expansion is simply replacing “missing” money from the economy? If you take a look (below), I have the participation rate now alongside the Fed’s balance sheet. I have inverted the balance sheet so that you can see the positive correlation more clearly. What this is telling us is that the expansion of the Fed’s balance sheet is simply replacing the decline in spending due to an aging demographics. In other words, the Fed is pouring water into a leaking bucket. The Fed’s expanding balance sheet is merely keeping the economy afloat. Inflation in the real economy on a broad level is not very likely to materialize anytime soon, which I spoke a lot more about here.
If you look at the US economy from the perspective of the labor force and age demographics, it’s clear that economy hasn’t yet recovered from the GFC, let alone the Covid pandemic. It suggests the road up ahead will be a lot bumpier than many are anticipating. Workers are not only not reentering the workforce like they were expecting to, they are in fact exiting it. Combine this with the aging demographic and it tells us the Fed’s balance sheet expansion is not enough to combat the deflationary forces at play. This is not March or April, the economy has been reopened for months and the recovery has come to a halt. The economy hasn’t just “slowed” like the recent narrative suggests, it is turning back down. The attempted “recovery” gave it its best shot but came up short. The consensus for inflation and growth in the near-term is a far-reach, at best.
Now, what does this mean for financial assets? I think we are due for an insolvency event. Given what the labor market is suggesting and the fact that a lot of payments (rents, mortgages, product inventories, loans, etc.) are becoming due since they were deferred back in March, it is going to cause a lot of business and household insolvencies. Remember, despite the dropping unemployment rate, there are still 20 million unemployed, with many set to lose their benefits at the end of December. When this occurs, we will get another US Dollar funding squeeze similar to what we saw in March. Risk assets and even safe assets like US Treasuries and Gold were sold to obtain Dollars in order to service existing debts and I expect the same to happen again. I think an insolvency event is almost inevitable and is going to happen sooner than many realize— unless the federal government can get money directly to people (and fast) in order to try to delay such an event from happening.
Author

Ryan Miller
Ryan Miller Trading Economics
Ryan Miller received a Bachelors Degree in History from William Paterson University. Through his studies of U.S. history, he developed an interest in the implications the financial markets have on the economy.


