|

GBP/USD analysis: inflation ok, but what about employment?

GBP/USD Current price: 1.3270

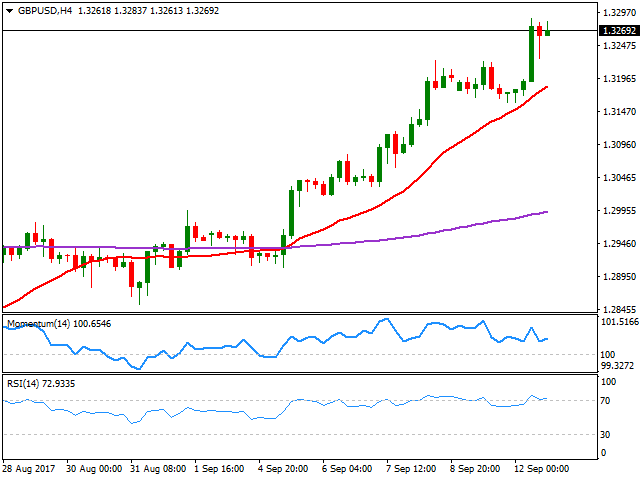
The GBP/USD trades at fresh 2017 highs by the end of the US session, not far from the early high set at 1.3287. The Pound was supported early Asia by news indicating that the EU withdrawal bill passed smoothly through the House of Commons, with discussions on possible amendments set for next October. For now, however, PM May cached a breath. The pair soared after the release of UK inflation figures for August, as the CPI rebounded to 2.9% yearly basis, from 2.6% in July. For the month, inflation increased by 0.6% from previous -0.1% whilst the core yearly inflation resulted at 2.7%. Inflation at factory gates was also higher than forecasted, up for the first time in six months, with output prices up by 3.4% in the year to August. Speculation that the BOE will have no choice but to raise rates with growing inflation and wages lagging, was behind Pound's rally.  The UK will release its latest employment figures this Wednesday, and wages will determinate whether current upward momentum would extend or not. The pair pulled back to 1.3227 early US session, but quickly regained the upside, heading into the Asian opening near the mentioned yearly high. Technically, the pair remains biased higher short term, given that in the 4 hours chart the price met buying interest around a sharply bullish 20 SMA, whilst technical indicators are currently aiming to regain the upside after correcting early overbought conditions. An extension beyond the daily high should expose the 1.3347 level, September 2016 high, while steady gains beyond this last should lead to a sustained rally up to 1.3500.

Support levels: 1.3225 1.3180 1.3140

Resistance levels: 1.3290 1.3345 1.3395

View Live Chart for the GBP/USD

Author

Valeria Bednarik

Valeria Bednarik was born and lives in Buenos Aires, Argentina. Her passion for math and numbers pushed her into studying economics in her younger years.

More from Valeria Bednarik
Share:

Editor's Picks

AUD/USD eyes 0.7150 barrier nine-day EMA

AUD/USD inches higher after registering modest losses in the previous day, trading around 0.7130 during the Asian hours. The technical analysis of the daily chart indicates that the pair is moving sideways within the rectangle pattern, suggesting a consolidation as neither the bulls nor the bears have enough momentum to take control of the market.

USD/JPY trades below 160.00 intervention threshold; bullish bias intact

The USD/JPY pair attracts some sellers during the Asian session amid fears that authorities will step in again to prop up the Japanese Yen. Furthermore, the Israel-Lebanon truce prompts some profit-taking around the US Dollar and exerts downward pressure on the currency pair.

Gold extends rebound to $4,500 as US yields edge lower

Gold (XAU/USD) preserves its recovery momentum following Wednesday's slide and tests the $4,500 mark in the second half of the day on Thursday. While US-Iran uncertainty remains, easing tensions between Lebanon on Israel seems to be helping the market mood improve, causing the USD to lose strength alongside falling US T-bond yields and opening the door for a decisive rebound in XAU/USD.

Bitcoin’s massive storm is back: Why the sell-off is far from over

Bitcoin price action over the last few weeks has felt less like a normal, healthy correction and more like a slow grinding crash that continues to wreak havoc on holdings and trading accounts. And everything suggests that the dramatic crash isn’t over.

Nonfarm payrolls: Testing the limits of Fed policy patience

The upcoming nonfarm payrolls report for May will provide the final update on the US labor market before Kevin Warsh attends his first policy meeting as the new Fed Chair later this month.

Recession on paper: What really moves the Canadian Loonie now?

Statistics Canada handed the headline writers a gift and the analysts a headache. Real GDP shrank 0.1% on an annualized basis in the first quarter, and with the fourth quarter of 2025 revised down to a 1.0% contraction, that is two negative quarters in a row, the textbook definition of a technical recession and Canada's first since the pandemic.