Near term crude oil outlook:
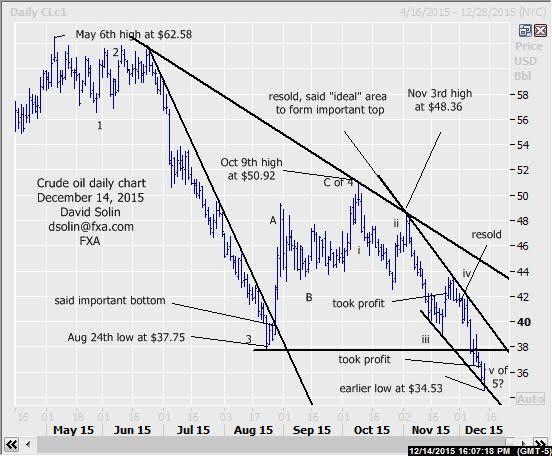
The bearish view over the last few months of a final decline below the Aug low at $37.75, "ideally" into the mid/late Dec timeframe as part of a final "washout" (across a number of commodities) has indeed played out right on schedule. Note too that the market has reached that long term support/target (and "ideal" area to form a more major bottom) in the $34.00/50 area (see longer term below) earlier today. Nearer term, there are lots of positives and include an oversold market after the last few months of sharp declines, the seasonal chart that bottoms around this time (see 3rd chart below) and seen within the final downleg in the fall from the Oct 9th high at $50.92 (wave v, as well as the final downleg in the fall from the May high at $62.58, wave 5). However, there is still no confirmation of even a shorter term bottom "pattern-wise", while another upleg is seen in the US$ ahead (inverse relationship) and in turn leaves open scope for a more extended/complex period of ranging/basing ahead. This type action (broad choppiness) is a common occurrence at more significant turning points and along with this week's Fed meeting (and likely rate hike) and thinning markets (end of year), appears to be more likely in this instance ahead. Nearby resistance is seen at $37.75/00 (broken Aug low) and the ceiling of the bear channel from Nov (currently at $40.20/45). Bottom line: finally into that longer term $34.00/50 support and "ideal" area to form a more major bottom, but no confirmation of even a shorter term low so far.
Strategy/position:
Short from the Dec 2nd resell at $40.97. Though there is still no confirmation of even a shorter term low (so far), there is potential for near term volatility (increases risk in the position) and as part of a larger bottoming (limited further downside). So now, would just take profit here (currently at $36.22 for $4.75). However, will not just reverse to the long side given that risk for more bottoming/volatility nearby. Remember, there is a higher threshold for entering a position (versus just a view).
Long term outlook:
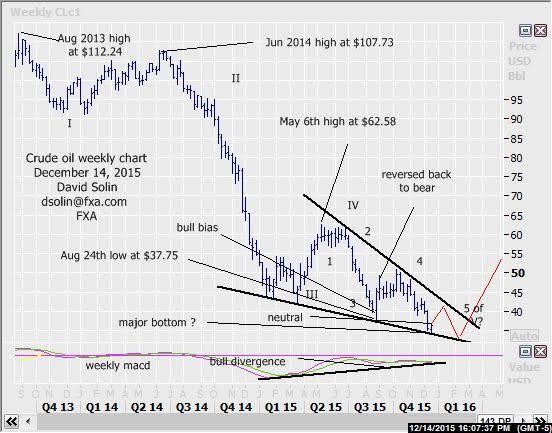
As discussed above, the market has finally reached that long discussed $34.00/50 support area (year long falling support line/base of a potential falling wedge/bottom pattern, see weekly chart/2nd chart below), and "ideal" area to form an even more major bottom (9-12 months or more). Note that the market is also seen within the final downleg in the whole decline from the Aug 2013 high at $112.24 (wave V), while technicals have not confirmed either the Aug or more recent lows (see bullish divergence on the weekly macd for example). However, don't expect a major "V" type bottom, but potentially an even more significant period of basing (months), and likely with good sized swings ($7-8/bbl) as part of the process (see in red on weekly chart/2nd chart below). Such action would likely driven by people shorting/hedging and offset by bouts of short covering. Additionally will just take time to work through the excess supply (needed before a major upmove can be seen). Finally, Also interesting that many are still trying to "pick" the bottom, not usually seen at major turning points and adds to the view of a more extended period of wide ranging/basing to wash that sentiment out. Bottom line: within the "ideal" $34.00/50 area to form a more major bottom, but likely to see an extended period (months) of a wide chopping/basing ahead.
Strategy/position:
Reversed the longer term bullish bias that was put in place on Aug 27th at $40.00 to bearish on Sept 3rd at $48.00. However, with further big picture downside seen limited (and rising potential for god sized bounces), just not seen as a good risk/reward in staying so would just switch to neutral here (currently at $36.22 for $11.78).
Recommended Content
Editors’ Picks
EUR/USD clings to gains above 1.0750 after US data

EUR/USD manages to hold in positive territory above 1.0750 despite retreating from the fresh multi-week high it set above 1.0800 earlier in the day. The US Dollar struggles to find demand following the weaker-than-expected NFP data.
GBP/USD declines below 1.2550 following NFP-inspired upsurge

GBP/USD struggles to preserve its bullish momentum and trades below 1.2550 in the American session. Earlier in the day, the disappointing April jobs report from the US triggered a USD selloff and allowed the pair to reach multi-week highs above 1.2600.
Gold struggles to hold above $2,300 despite falling US yields

Gold stays on the back foot below $2,300 in the American session on Friday. The benchmark 10-year US Treasury bond yield stays in negative territory below 4.6% after weak US data but the improving risk mood doesn't allow XAU/USD to gain traction.
Bitcoin Weekly Forecast: Should you buy BTC here? Premium

Bitcoin (BTC) price shows signs of a potential reversal but lacks confirmation, which has divided the investor community into two – those who are buying the dips and those who are expecting a further correction.
Week ahead – BoE and RBA decisions headline a calm week

Bank of England meets on Thursday, unlikely to signal rate cuts. Reserve Bank of Australia could maintain a higher-for-longer stance. Elsewhere, Bank of Japan releases summary of opinions.

