$/yen near term outlook:
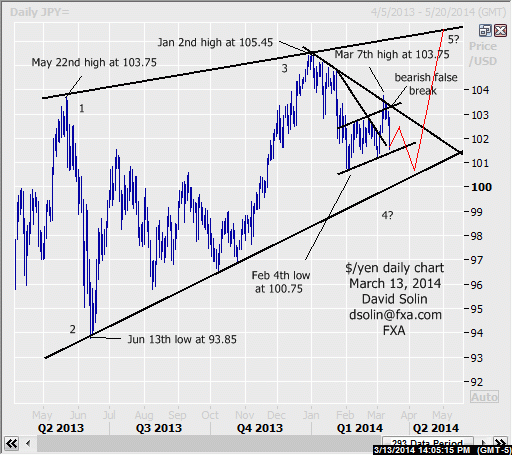
No change in the long held view of a large, complex topping since the May high at 103.75. Potentially forming a rising wedge/reversal pattern over that time, leaving open scope for another few weeks (or more) of wide ranging within the pattern, and potentially even a final test (and temporary break) of the Jan high at 105.45 as part of the process. Note that these patterns break down into 5 legs, adding to the potential for further ranging within the pattern ahead (see "ideal" scenario in red on daily chart below). Currently, the market is tumbling from the Mar 7th high at 103.75, breaking back below the key 103.15/35 area (ceiling of bull channel since Feb 4th, bear t-line and 50% from Jan high at 105.45, a bearish false break). As been discussing in my blog at http://www.fxa.com/solin/comments.htm targets declines below that Feb 4th low at 100.75 toward the base of the large wedge (currently at 99.80/05), and before potentially completing a more important bottom. Nearby support is seen at the base of the bullish channel (currently at 101.25/40), resistance is seen at 102.60/75 and again that key 103.15/35 area.
Strategy/position:
With eventual declines below the Feb low at 100.75 favored, want to be short. However, with further downside potentially limited, not seen as a good risk/reward in just hitting bids here. So instead for now, would wait for near term bounce toward 102.50 to sell and then initially stopping on a close 15 ticks above that key 103.15/35 resistance area. Note was stopped on the Mar 3rd sell at 101.50 on March 5th above the bear t-line from Jan 23rd (then 102.10, closed at 102.30).
Long term outlook:
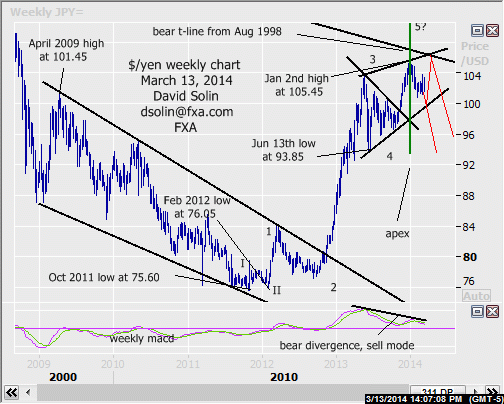
As discussed above, the rangy trade since May is seen as a "complex" topping, and with at least 9-12 months of correcting lower after. Note too that long term technicals continues to deteriorate (see bear divergence/sell mode on the weekly macd), and appear to be within the final upleg in the 5 wave upmove from the Feb 2012 low at 76.05. At this point, the exact shape of this major topping is a question, with scope for gains back to the that Jan high at 105.45 (and even slightly above, see in red on weekly chart/2nd chart below) as part of this longer term topping process (rising wedge scenario). However, a clear break/close below that bullish trendline from June/base would greatly increase the likelihood that the final high is already in place.
Strategy/position:
As these wedge patterns form, there is little in the way of "net" price progress, but good profit can often be made by looking to fade the extremes of the pattern (6-7 yen in this case). So in general, would take that approach and with near term downside toward the base favored ahead, would be looking for signs of an important bottoming on an approach to switch the longer term bias to the bullish side.
Current:
- Nearer term: sell near term bounce toward 102.50 for base of large wedge since May.
- Last: short Mar 3 at 101.50, stopped Mar 5th above t-line from Jan 23rd (102.10, closed 102.30).
- Longer term: larger topping over last few months, possible rising wedge, look to fade extremes.
- Last: bullish bias Dec 19th at 104.10 to neutral Jan 16th at 104.45.
General Risk Warning for stocks, cryptocurrencies, ETP, FX & CFD Trading. Investment assets are leveraged products. Trading related to foreign exchange, commodities, financial indices, stocks, ETP, cryptocurrencies, and other underlying variables carry a high level of risk and can result in the loss of all of your investment. As such, variable investments may not be appropriate for all investors. You should not invest money that you cannot afford to lose. Before deciding to trade, you should become aware of all the risks associated with trading, and seek advice from an independent and suitably licensed financial advisor. Under no circumstances shall Witbrew LLC and associates have any liability to any person or entity for (a) any loss or damage in whole or part caused by, resulting from, or relating to any transactions related to investment trading or (b) any direct, indirect, special, consequential or incidental damages whatsoever.
Recommended Content
Editors’ Picks
EUR/USD clings to gains above 1.0750 after US data

EUR/USD manages to hold in positive territory above 1.0750 despite retreating from the fresh multi-week high it set above 1.0800 earlier in the day. The US Dollar struggles to find demand following the weaker-than-expected NFP data.
GBP/USD declines below 1.2550 following NFP-inspired upsurge

GBP/USD struggles to preserve its bullish momentum and trades below 1.2550 in the American session. Earlier in the day, the disappointing April jobs report from the US triggered a USD selloff and allowed the pair to reach multi-week highs above 1.2600.
Gold struggles to hold above $2,300 despite falling US yields

Gold stays on the back foot below $2,300 in the American session on Friday. The benchmark 10-year US Treasury bond yield stays in negative territory below 4.6% after weak US data but the improving risk mood doesn't allow XAU/USD to gain traction.
Bitcoin Weekly Forecast: Should you buy BTC here? Premium

Bitcoin (BTC) price shows signs of a potential reversal but lacks confirmation, which has divided the investor community into two – those who are buying the dips and those who are expecting a further correction.
Week ahead – BoE and RBA decisions headline a calm week

Bank of England meets on Thursday, unlikely to signal rate cuts. Reserve Bank of Australia could maintain a higher-for-longer stance. Elsewhere, Bank of Japan releases summary of opinions.

