Today at 14:30 GMT will see EIA data released for crude oil stocks. Last week’s figure saw a reduction in supply and was -4.407 million and this week’s expected forecast is also negative at -1.4 million. A larger than expected negative number means reduced supply and could send the price of crude oil up sharply whilst a substantially higher positive number could send crude oil on its way back down again.
Looking at the day chart we can see a two candle reversal pattern formed over the previous two trading sessions, blue area. This is the first time this type of pattern has formed since price returned to its bear trend in June. Price is also extremely far away from the Ichimoku cloud, by approximately 20%, this is a sign that the market may be well oversold at this point.
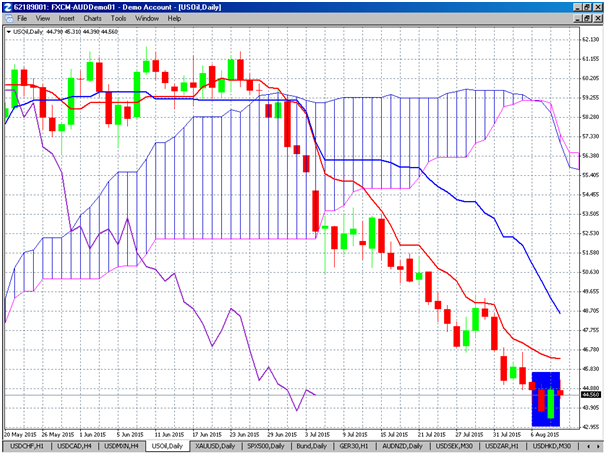
EIA stock data has been negative for most of the past 12 weeks and oil price has been falling, considering the reduction in Rigs internationally and such a low current price there could be room for a correction upward.
Trading Crude WTI Oil
With the prospect that there could be more volatility in the market after today’s data, one way to take advantage of this is to buy a straddle option strategy. This consists of buying a Call and a Put simultaneously with the same strike rate and expiry date and for the same amount. As you can see from the ORE Web-Platform 'add new position' page below there are two lines, one to buy a Call option and the other to buy a Put option. This total cost to buy this position is $165.68, that is to buy a Call and a Put with a strike rate 43.65 for 100 barrels and 5-day expiry.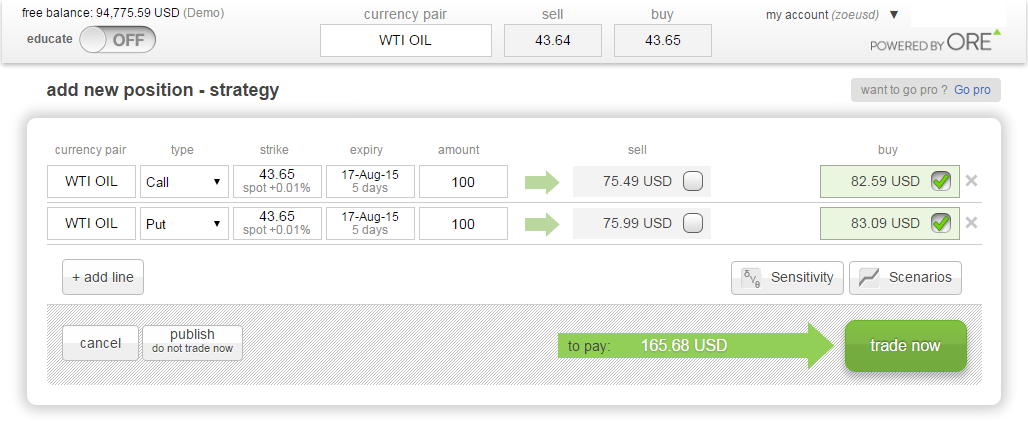
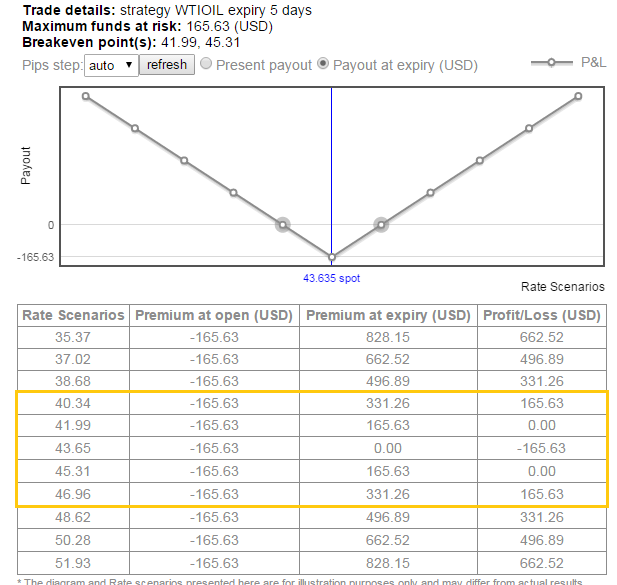
If WTI Oil prices moves far enough, either up or down, by expiry on Monday 14th August 2pm GMT the position may return a profit. By clicking the Scenarios button you can evaluate the positions payout over a range of oil prices. Below is the Scenario chart and table, you can see the position is at break-even (by expiry) when oil price is 41.99 or 45.31 per barrel. If oil remains in this range the position will make a loss, if oil breaks out of this range the position will profit.
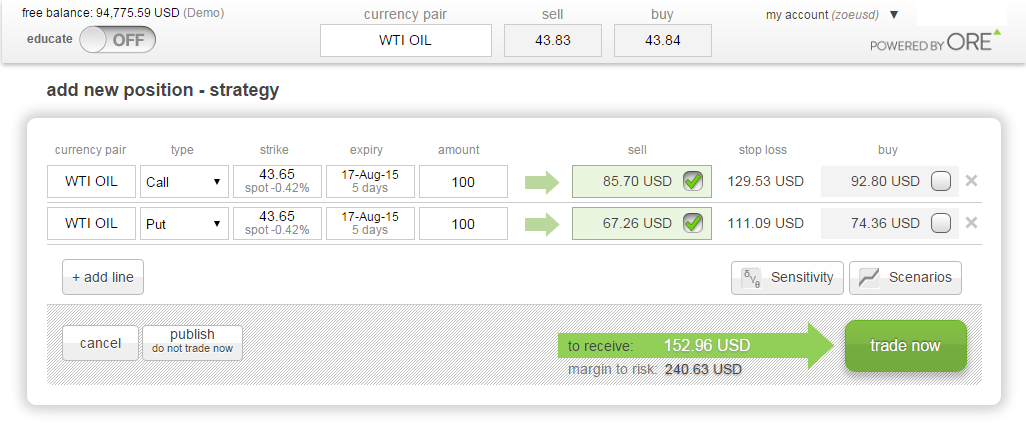
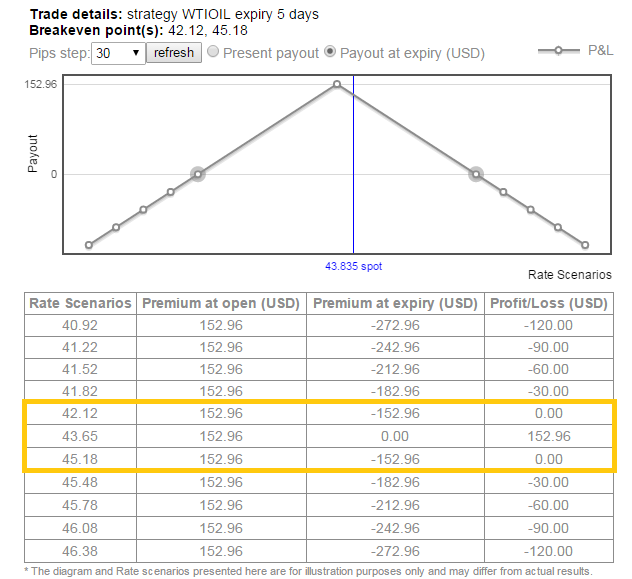
If however you think there will be less volatility, EIA stock data will be pretty much as expected, and the market will remain at these new lows for the next 5-days to take advantage of this scenario you may sell a straddle strategy. This consists of simultaneously selling a Call and a Put with the same strike, expiry and amounts. As can be seen from the screen shot below, this will earn you a maximum profit of $152.96 as long as both options expire worthless.
If WTI Oil prices trade within a range until expiry on Monday 14th August 2pm GMT the position will return a profit. The Scenario chart and table below, shows that the position will make maximum profit if Oil price expires at the 43.65 strike. However, if oil breaks-out of the range a loss will be made, this loss can be managed using stop-loss orders.
To practice trading option strategies and analyze payouts open a FREE demo account.
1. http://www.worldoil.com/news/2015/8/08/us-rig-count-rises-by-10-international-count-down-28
The content provided is made available to you by ORE Tech Ltd for educational purposes only, and does not constitute any recommendation and/or proposal regarding the performance and/or avoidance of any transaction (whether financial or not), and does not provide or intend to provide any basis of assumption and/or reliance to any such transaction.
Recommended Content
Editors’ Picks
EUR/USD clings to gains above 1.0750 after US data

EUR/USD manages to hold in positive territory above 1.0750 despite retreating from the fresh multi-week high it set above 1.0800 earlier in the day. The US Dollar struggles to find demand following the weaker-than-expected NFP data.
GBP/USD declines below 1.2550 following NFP-inspired upsurge

GBP/USD struggles to preserve its bullish momentum and trades below 1.2550 in the American session. Earlier in the day, the disappointing April jobs report from the US triggered a USD selloff and allowed the pair to reach multi-week highs above 1.2600.
Gold struggles to hold above $2,300 despite falling US yields

Gold stays on the back foot below $2,300 in the American session on Friday. The benchmark 10-year US Treasury bond yield stays in negative territory below 4.6% after weak US data but the improving risk mood doesn't allow XAU/USD to gain traction.
Bitcoin Weekly Forecast: Should you buy BTC here? Premium

Bitcoin (BTC) price shows signs of a potential reversal but lacks confirmation, which has divided the investor community into two – those who are buying the dips and those who are expecting a further correction.
Week ahead – BoE and RBA decisions headline a calm week

Bank of England meets on Thursday, unlikely to signal rate cuts. Reserve Bank of Australia could maintain a higher-for-longer stance. Elsewhere, Bank of Japan releases summary of opinions.