Still on the road that the moment and rather than comment on the ridiculous machinations of what the Greek Prime Minister said last night – that even if Greece votes no they can stay in the Euro – or even talk about the 3.6% falls in the DAX (nice charts lately hey) and the CAC, or the massive reversal in the Euro – setting up more gains possibly. I want to focus on the outlook for the S&P 500 today.
That’s because the S&P is the global stock market bellwether, the one all other markets look to for guidance.
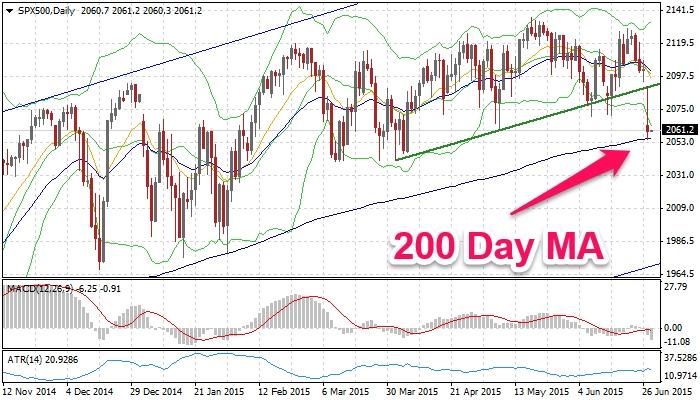
Last night the S&P dropped 2.07% to close around 2058. That’s just above the 2053/55 region where, depending on who you ask, the 200 day moving average is sitting.
As you know the 200 day moving average is the simplest, and often the first, way many traders use to judge whether a market is in a bull or bear phase. Above it, buy the dip, below it sell rallies is what is often said.
You can see in the chart above the break of recent trendline and then the support the 200 day moving average gave the market overnight.
As I wrote at Business Insider this morning:
The big question for fund and portfolio managers – and for traders and investors – is whether or not they try to get out of dodge early to avoid further losses or they hang on in the hope that like every other hiccup in the last 3 or 4 years, weakness gives way to a bounce.
The 200 day moving average is an important part of those deliberations. SO to is the 4 year uptrend on a weekly basis.
But I want you to also think about the overall market structure.
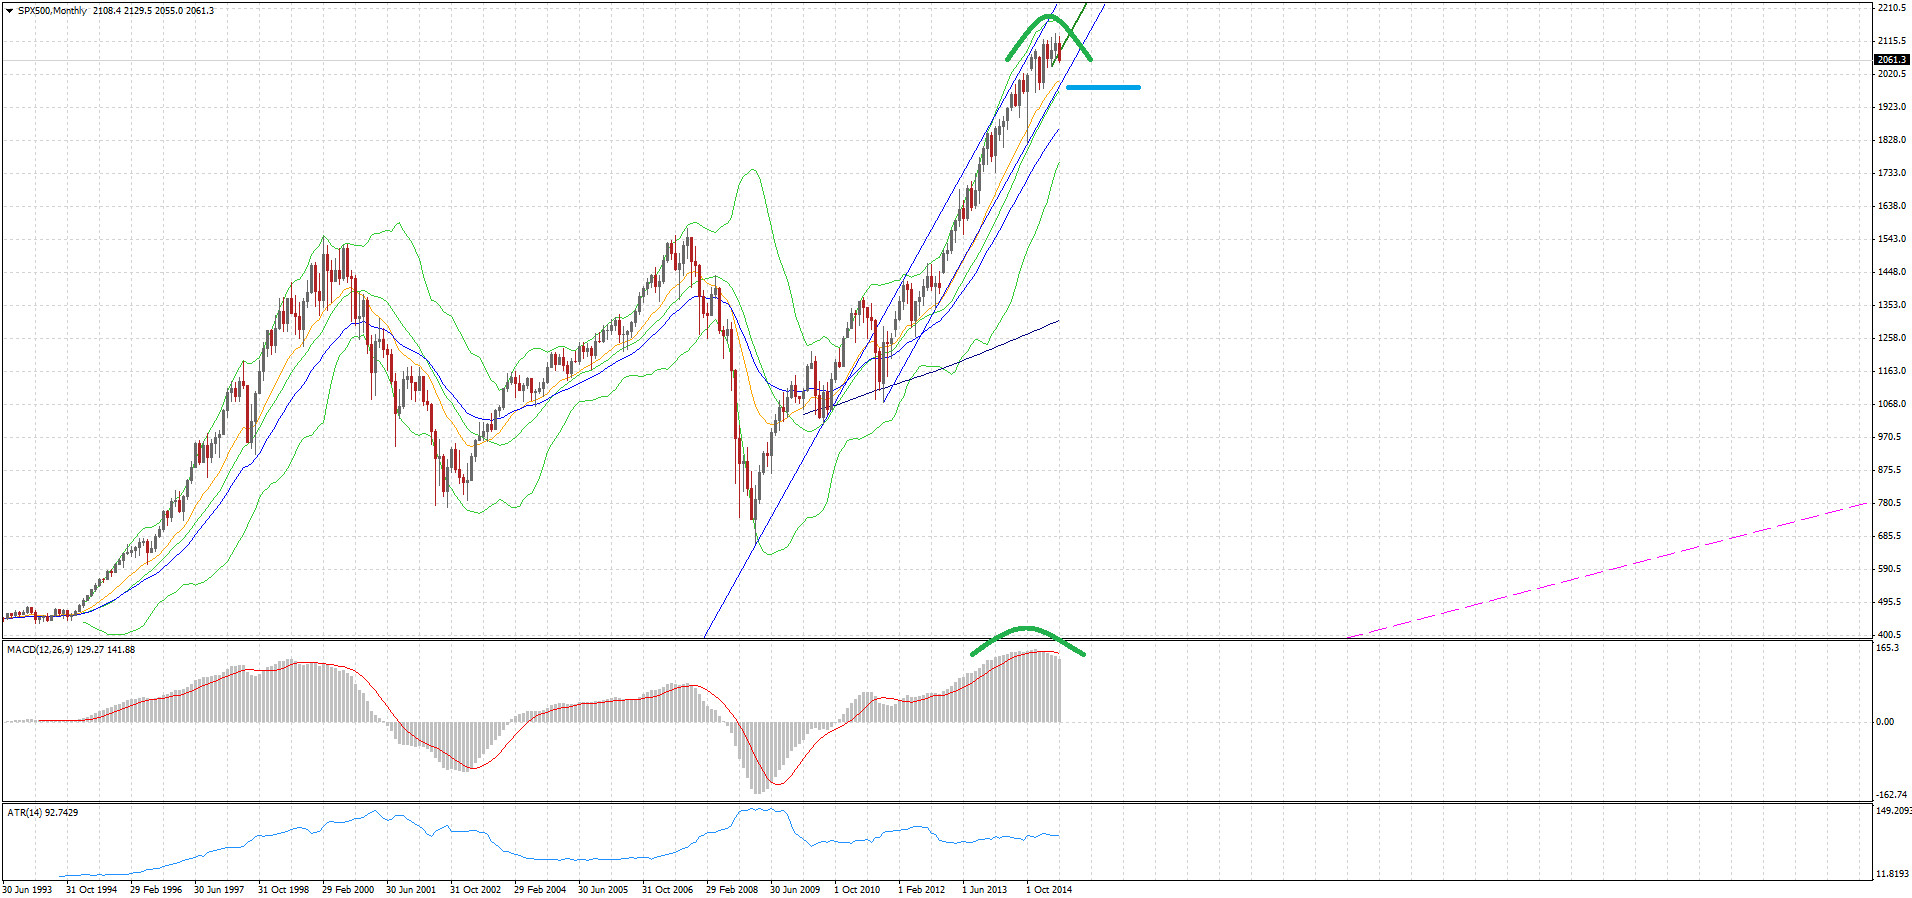
Have a look at the monthly S&P chart. Remind you of anything? Shanghai recently? Gold half a decade ago?.
This is a monthly chart so it will take a while to play out. But history and my system suggest winter is coming.
Recommended Content
Editors’ Picks
EUR/USD clings to gains above 1.0750 after US data

EUR/USD manages to hold in positive territory above 1.0750 despite retreating from the fresh multi-week high it set above 1.0800 earlier in the day. The US Dollar struggles to find demand following the weaker-than-expected NFP data.
GBP/USD declines below 1.2550 following NFP-inspired upsurge

GBP/USD struggles to preserve its bullish momentum and trades below 1.2550 in the American session. Earlier in the day, the disappointing April jobs report from the US triggered a USD selloff and allowed the pair to reach multi-week highs above 1.2600.
Gold struggles to hold above $2,300 despite falling US yields

Gold stays on the back foot below $2,300 in the American session on Friday. The benchmark 10-year US Treasury bond yield stays in negative territory below 4.6% after weak US data but the improving risk mood doesn't allow XAU/USD to gain traction.
Bitcoin Weekly Forecast: Should you buy BTC here? Premium

Bitcoin (BTC) price shows signs of a potential reversal but lacks confirmation, which has divided the investor community into two – those who are buying the dips and those who are expecting a further correction.
Week ahead – BoE and RBA decisions headline a calm week

Bank of England meets on Thursday, unlikely to signal rate cuts. Reserve Bank of Australia could maintain a higher-for-longer stance. Elsewhere, Bank of Japan releases summary of opinions.

