FX Breakout Monitor: CHF weakness extends, gold breaks lower

Summary: The most prominent recent development among G10 majors has been the persistent weakness in the Swiss franc, where safe haven demand has evaporated after the long Brexit delay and on rising yields and the generally supportive risk-on trading environment.
The Swiss franc decline has persisted with remarkable consistency recently, with the smooth appreciation in EURCHF suggesting this pair is the dominant driver. The main cause is likely the rise in global yields of the last couple of weeks and hopes that the Eurozone outlook has bottomed and is set to turn higher again. Elsewhere, the JPY is also weak on the same general risk-on complacency and rising yield backdrop.
We close up shop for the FX Breakout Monitor until next Tuesday. Pairs to watch until then included USDCHF (more major range break above 1.0100), USDJPY (trying to break the 112.00+ range resistance), AUDUSD (the 0.7200 area) and EURGBP (0.8650-0.8700 pivot zone) and GBPUSD (1.3000 area).
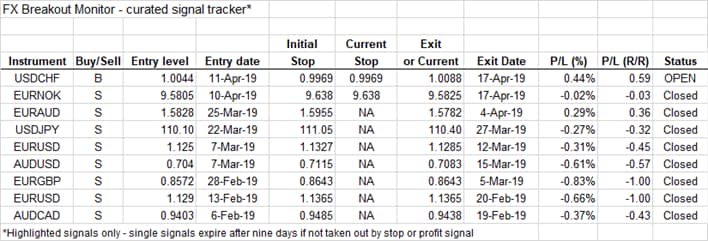
Breakout signal tracker
With a five day weekend ahead in Denmark (poor us) and three day weekend for the US and most European markets, we’ll take off our current positions and start with a clean slate next week. Anyone trading USDCHF may look for another day of upside potential, but certainly consider raising stops to avoid taking any sizable loss on a long position. (as well, an ugly set of flash April Eurozone PMIs tomorrow morning could see a significant setback for EURCHF and drive some CHF strength in crosses for a session or more. The EURNOK downside breakout has been a real disappointment, given the backdrop of market developments looked so supportive – but we haven’t fared much worse than breakeven there.
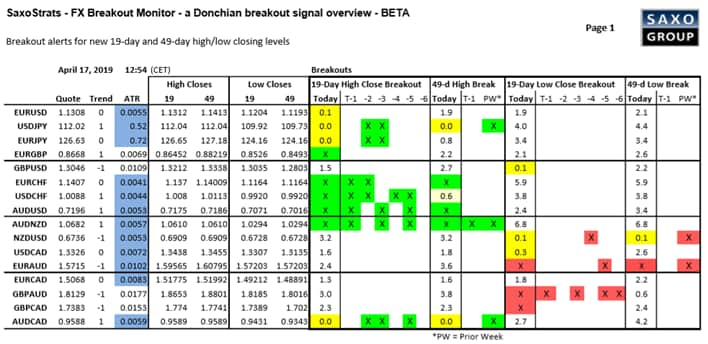
Today’s FX Breakout monitor
Page 1: Note here that while EURUSD is perched near a 19-day high close, the range up to 1.1500 is very heavy – though a positive round of Eurozone PMIs tomorrow could spark a rally. Also note that EURGBP is poking at an upside breakout level here (arguably, the 0.8700 area is more important) and GBPUSD is doing the same. But the CHF weakness is providing a good deal of the green colouring on Page 1 here via EURCHF and USDCHF breakouts – both of those pairs are nearing resistance, especially USDCHF. AUD strength also very broad-based – interesting to see how that holds up over Australian jobs numbers tonight.
Page 2: Note the important line in the sand on the USDNOK chart we discuss below as USDNOK is trading within striking distance of a major level. The strong risk sentiment in evidence for the major non-Asian EM currencies, as RUB, MXN and ZAR all poised near new highs versus the greenback. Gold is in the opposite boat as we look at in the chart below.
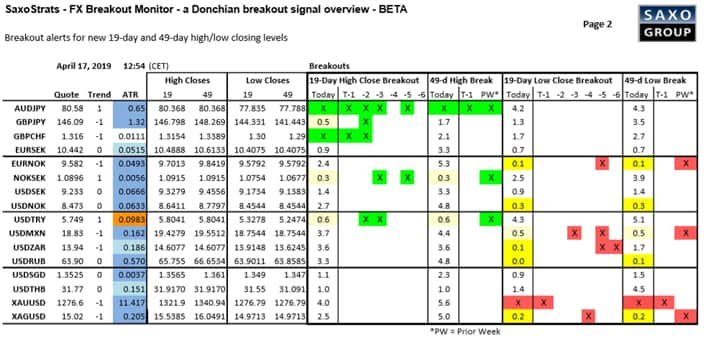
Chart: USDNOK
NOK traders have been frustrated by the inability of the key EURNOK pair to punch through support despite a very supportive backdrop. In the meantime, the USDNOK pair has meandered toward a very pivotal level to the downside around 8.45-40. A significant move lower likely needs positive data catalysts to drive a move in EURUSD towards 1.1500.
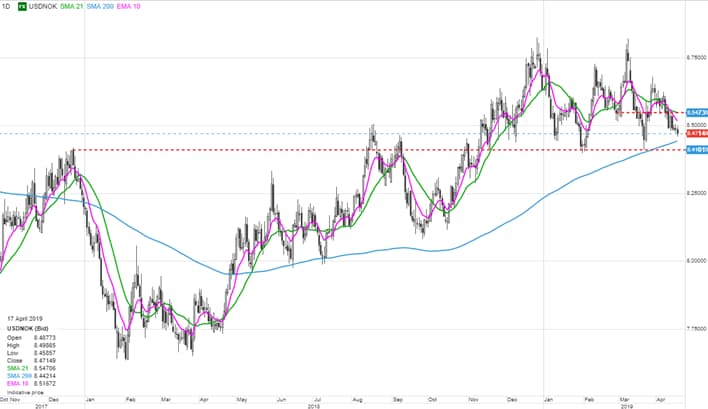
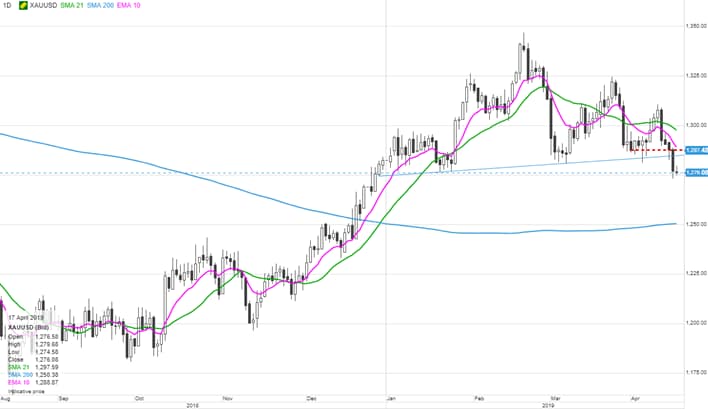
Chart: XAUUSD
Gold has been sliding badly of late, likely a mirror image of rising long bond yields – and the support level taken out throws down the gauntlet against the gold bulls…next important level down towards 1,250, the psychological and 200-day moving average area.
REFERENCE: FX Breakout Monitor overview explanations
The following is a left-to-right, column by column explanation of the FX Breakout Monitor tables.
Trend: a measure of whether the currency pair is trending up, down or sideways based on an algorithm that looks for persistent directional price action. A currency can register a breakout before it looks like it is trending if markets are choppy.
ATR: Average True Range or the average daily trading range. Our calculation of this indicator uses a 50-day exponential moving average to smooth development. The shading indicates whether, relative to the prior 1,000 trading days, the current ATR is exceptionally high (deep orange), somewhat elevated (lighter orange), normal (no shading), quiet (light blue) or exceptionally quiet (deeper blue).
High Closes / Low Closes: These columns show the highest and lowest prior 19- and 49-day daily closing levels.
Breakouts: The right-most several columns columns indicate whether a breakout to the upside or downside has unfolded today (coloured “X”) or on any of the previous six trading days. This graphic indication offers an easy way to see whether the breakout is the first in a series or is a continuation from a prior break. For the “Today” columns for 19-day and 49-day breakouts, if there is no break, the distance from the current “Quote” to the break level is shown in ATR, and coloured yellow if getting close to registering a breakout.
NOTE: although the Today column may show a breakout in action, the daily close is the key level that is the final arbiter on whether the breakout is registered for subsequent days.
Read the original article: FX Breakout Monitor: CHF weakness extends, gold breaks lower
Author

Saxo Team of Analysts
Saxo Bank


