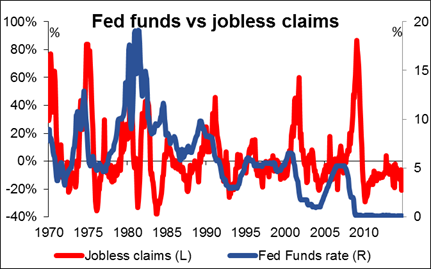
US GDP revisions shock…again It was only a six months ago that the third revision of US Q1 GDP shocked the market with a 1.9 percentage point downward revision to -2.9% qoq SAAR. Now the opposite: a 1.1 ppt upward revision to Q3 to +5.0% qoq SAAR. So in just six months, the US economy has gone from recession-level contraction to the fastest rate of growth in over a decade. The rest of the US indicators were mixed, with November durable goods orders weak but personal income and expenditure better than expected, but that didn’t matter; markets focused on the GDP figure. US interest rates jumped, with the implied rate on the long end Fed funds futures contract rising 5-6 bps and 10-year yields soaring 10 bps. As a result, the dollar rose against almost all the G10 currencies and hit a high for the year against several – EUR, GBP, CHF and AUD, for example. This is the trend that I expect to dominate the FX market during 2015: US economic outperformance leading to higher interest rates and USD outperformance.
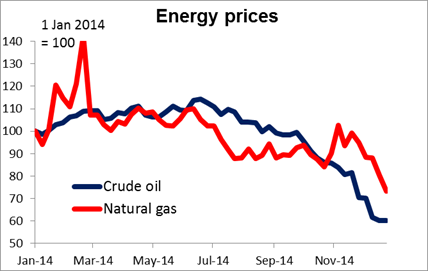
Oil rallied somewhat on the higher US GDP figure on hopes that faster economic growth might boost demand for energy. However, the weather suggests otherwise. While the market has been fixated on lower oil prices, natural gas prices have been falling too, in this case because of unseasonably warm weather in the US. The price fell over 9% on Monday alone and is now at a two-year low. This is also going to save the US consumer money. Recent forecasts are for the relatively warm weather to persist in January and February in many parts of the US, which won’t add to demand for heating fuel. It’s an open question what an unusually warm winter means for growth – often when the weather is unseasonably warm in winter or cool in summer, people buy less seasonal goods and growth can slow. Plus of course energy demand for heating is counted in consumption, too.
The second round of the Greece Presidential election failed to elect the government’s presidential candidate, Stavros Dimas, bringing early elections a step closer. Dimas got only 168 votes, which was in the middle of expectations. The Greek press is reporting that “it currently seems very difficult” for the government to get the 180 votes that it needs on Dec. 29th and that a general election in late January or early February “seems inevitable.” That could be a sensitive time for EUR/USD. The market is already through the consensus forecast for Q1 2015 (1.22, according to Bloomberg) and so it would come as a surprise – meaning there could be a lot of position-adjusting.
We have little on Wednesday’s agenda. The only noteworthy indicator we get is the US initial jobless claims for the week ended Dec. 20. The market consensus is for the number to remain more or less unchanged. The 4 week moving average is expected to decline to 293k from 299k, consistent with an improving labor market.
NOTE: There will be no market comment Thursday or Friday. Happy holidays!
The Market
EUR/USD finds support near 1.2160 area
EUR/USD plunged following the strong US Q3 GDP data to find support a few pips above our 1.2160 (S1) level, the lows of 3 August 2012. Given the positive sentiment towards USD and the absence of any material economic events today, a break of that level could challenge our next support line of 1.2120 (S2). Looking at our short-term momentum studies, the RSI has been moving along the 30 line since 17th of December, while the MACD lies below its trigger and zero lines. Although these indicators suggest accelerating bearish momentum, I would wait for a break of the 1.2160 (S1) support line for another leg down. On the daily chart, the rate is still printing lower lows and lower highs below both the 50- and the 200-day moving averages and this keeps the overall path to the downside.
Support: 1.2160 (S1), 1.2120 (S2), 1.2050 (S3)
Resistance: 1.2250 (R1), 1.2345 (R2), 1.2410 (R3)
USD/JPY testing 120.25 as a support
USD/JPY advanced on Tuesday and rose just above the resistance-turned-into-support of 120.25 (S1). During the early European hours the pair is testing the 120.25 (S1) support line and if the bears prove too weak to push the rate lower, I would expect for an advance towards our 121.85 (R1) resistance zone. Looking at our short-term momentum signals, the RSI found resistance just above the 70 line and moved down, while the MACD shows signs of topping and seems willing to cross below its trigger line. These signals indicate that the advance has lost some of its momentum and the bulls may not be strong enough to push the rate higher any time soon. In the bigger picture, the price structure is still higher highs and higher lows above both the 50- and the 200-day moving averages and this keeps the overall path of the pair to the upside.
Support: 120.25 (S1), 118.30 (S2), 117.35 (S3)
Resistance: 121.85 (R1), 122.44 (R2), 123.10 (R3)
GBP/USD falls below 1.5550
GBP/USD slid on Tuesday and broke our support-turned-into-resistance of 1.5550 (R1). I would expect the break of that strong level to trigger further extensions and could push the rate towards the 1.5420 (S2) support zone, defined by the lows of 8 August 2012. During early European hours the pair is testing our support level of 1.5500 (S1), where a break is necessary for further declines. Our short-term momentum indicators support this notion. The RSI found resistance at its 30 line and is pointing down, while the MACD, already below its trigger line, moved further into its negative territory. As for the broader trend, I still believe that as long as Cable is trading below the 80-day exponential moving average, the overall path remains negative.
Support: 1.5500 (S1), 1.5420 (S2), 1.5300 (S3)
Resistance: 1.5550 (R1), 1.5680 (R2), 1.5740 (R3)
WTI finds resistance at the 50-period moving average
WTI consolidated on Tuesday and remained capped below the 50-period moving average that provided good resistance to the price action recently. Following the sharp declines in recent months, WTI seems to have stabilized within this range, keeping the intraday bias neutral. Looking at our short-term momentum indicators, the RSI is moving along its 50 line, while the MACD crossed above its trigger line and is pointing sideways. These momentum signals suggest that the price is likely to continue consolidating within the aforementioned levels and it will take a decisive break in either direction to determine the near-term bias. On the daily chart, the overall path remains to the downside therefore I could treat any upside wave as a correction of the longer-term downtrend.
Support: 54.40 (S1), 52.60 (S2), 50.50 (S3)
Resistance: 58.60 (R1), 60.00 (R2), 62.00 (R3)
Gold well entrenched near the 1175 area
Gold remained well entrenched near the 1175 (S1) support area. There were one or two attempts to break that level but none found much support and the precious metal continued to trade just above that area. The failure to break that zone strengthens the likelihood for an upward movement, perhaps towards our 1186 (R1) resistance line. Our short-term momentum signals support the notion for an initial test of 1186 (R1) resistance zone. The RSI found support at its 30 line and moved up, while the MACD, although within its negative territory, poked its nose above the trigger line and points up.
Support: 1175 (S1), 1170 (S2), 1165 (S3)
Resistance: 1186 (R1), 1190 (R2), 1210 (R3)
BENCHMARK CURRENCY RATES - DAILY GAINERS AND LOSERS
MARKETS SUMMARY
Recommended Content
Editors’ Picks
EUR/USD clings to gains above 1.0750 after US data

EUR/USD manages to hold in positive territory above 1.0750 despite retreating from the fresh multi-week high it set above 1.0800 earlier in the day. The US Dollar struggles to find demand following the weaker-than-expected NFP data.
GBP/USD declines below 1.2550 following NFP-inspired upsurge

GBP/USD struggles to preserve its bullish momentum and trades below 1.2550 in the American session. Earlier in the day, the disappointing April jobs report from the US triggered a USD selloff and allowed the pair to reach multi-week highs above 1.2600.
Gold struggles to hold above $2,300 despite falling US yields

Gold stays on the back foot below $2,300 in the American session on Friday. The benchmark 10-year US Treasury bond yield stays in negative territory below 4.6% after weak US data but the improving risk mood doesn't allow XAU/USD to gain traction.
Bitcoin Weekly Forecast: Should you buy BTC here? Premium

Bitcoin (BTC) price shows signs of a potential reversal but lacks confirmation, which has divided the investor community into two – those who are buying the dips and those who are expecting a further correction.
Week ahead – BoE and RBA decisions headline a calm week

Bank of England meets on Thursday, unlikely to signal rate cuts. Reserve Bank of Australia could maintain a higher-for-longer stance. Elsewhere, Bank of Japan releases summary of opinions.

