Today we would like to focus your attention to Personal Composite Instrument (PCI) &BRENT_RUB, i.e. Brent crude oil to Russian ruble on the H4 chart. They are highly interconnected because Russia is the third largest oil producer after Saudi Arabia and the United States. The share of hydrocarbons in the country’s exports is 73%. When Brent crude oil price (denominated in USD) advances, as a rule, Russian ruble is sagging on the USD/RUB chart. This means that it is strengthening against the US dollar. You can implement the &BRENT_RUB PCI downloaded from our website in NetTradeX.
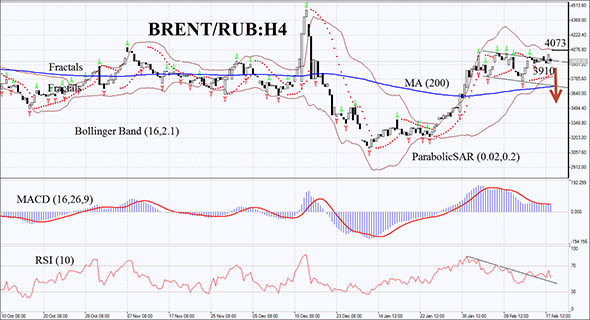
BRENT/RUB has formed the graphic pattern called “flag” on the H4 chart, and the price is currently located next to its upper boundary. Since the two assets of this PCI are highly correlated, they are mainly traded sideways. Therefore, we don’t expect a strong bullish momentum. BRENT/RUB will most likely return to its long-term moving average (200). There is a decline in volatility on the MACD chart. The histogram is below the signal line, which can be considered a bearish signal. There is a timid bearish divergence on the RSI chart. Bollinger Bands indicator shows narrowing. Further development of the bearish momentum is not ruled out after the fractal resistance breakout at 3910. This mark can be used for placing a pending sell order. Stop loss may be placed at the top line of Bollinger Bands indicator, which can currently act as a resistance line – 4073. After pending order placing, Stop loss is to be moved every four hours near the next fractal high, following Parabolic and Bollinger signals. Thus, we are changing the probable profit/loss ratio to the breakeven point. If the price meets Stop loss level without reaching the order, we recommend canceling the position: market sustains internal changes that were not considered.
- Position Sell
- Sell stop below 3910
- Stop loss above 4073
Recommended Content
Editors’ Picks
EUR/USD clings to gains above 1.0750 after US data

EUR/USD manages to hold in positive territory above 1.0750 despite retreating from the fresh multi-week high it set above 1.0800 earlier in the day. The US Dollar struggles to find demand following the weaker-than-expected NFP data.
GBP/USD declines below 1.2550 following NFP-inspired upsurge

GBP/USD struggles to preserve its bullish momentum and trades below 1.2550 in the American session. Earlier in the day, the disappointing April jobs report from the US triggered a USD selloff and allowed the pair to reach multi-week highs above 1.2600.
Gold struggles to hold above $2,300 despite falling US yields

Gold stays on the back foot below $2,300 in the American session on Friday. The benchmark 10-year US Treasury bond yield stays in negative territory below 4.6% after weak US data but the improving risk mood doesn't allow XAU/USD to gain traction.
Bitcoin Weekly Forecast: Should you buy BTC here? Premium

Bitcoin (BTC) price shows signs of a potential reversal but lacks confirmation, which has divided the investor community into two – those who are buying the dips and those who are expecting a further correction.
Week ahead – BoE and RBA decisions headline a calm week

Bank of England meets on Thursday, unlikely to signal rate cuts. Reserve Bank of Australia could maintain a higher-for-longer stance. Elsewhere, Bank of Japan releases summary of opinions.