![]() HY Markets Research Team
HY Markets Research Team
HY Markets
EUR/USD
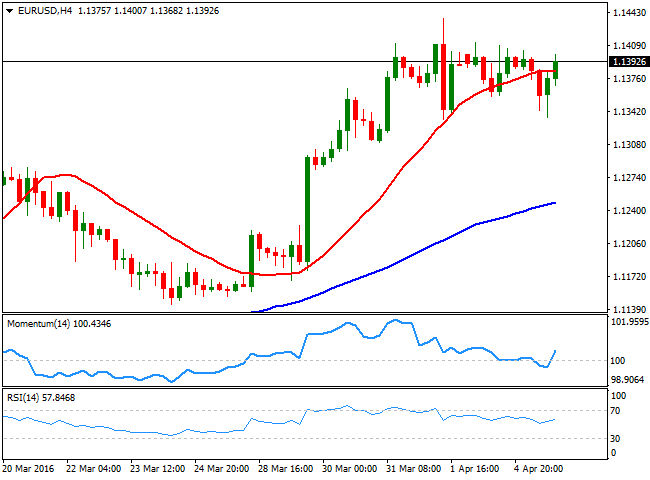
Risk aversion was the main theme this Tuesday, as poor PMI figures in Japan, and Europe fueled concerns over a global economic slowdown, sending worldwide equities nosediving. European data came out weaker thane xpected, as in the region, Services and Composite PMI figures, showed that growth decelerated by the end of the first quarter of the year. Also, German factory orders fell 1.2% in February, although retail trade in the EU increased 0.2% monthly basis, and 2.4% compared to a year before.In the US, data came in mixed, as the trade balance deficit widened to $47.06B, whilst total jobs opening in February reached 5.445M, slightly below expectations. The Markit services PMI surged to 51.3, while the ISM nonmanufacturing PMI printed 54.5, the highest in three month. In balance, data were pretty encouraging, but not enough to revert the negative tone of the greenback.The EUR/USD pair remained confined within Friday's range, flirting with the 1.1400 level by the end of the day and after trading as low as 1.1335 on the back of US strong services PMI readings, maintaining a neutral technical stance, but with bulls clearly not ready to give up. From a technical point of view, the risk remains towards the upside, particularly as the pair remains near its yearly high set last week at 1.1437, and intraday dips continue to attract buying interest. In the 4 hours chart, the technical indicators have turned north within neutral territory, while the price is hovering around a flat 20 SMA, suggesting the market will continue in wait and see mode, ahead of the upcoming minutes from both Central Banks and the wording of Draghi and Yellen next Thursday.
Support levels: 1.1330 1.1280 1.1245
Resistance levels: 1.1410 1.1460 1.1500
GBP/USD
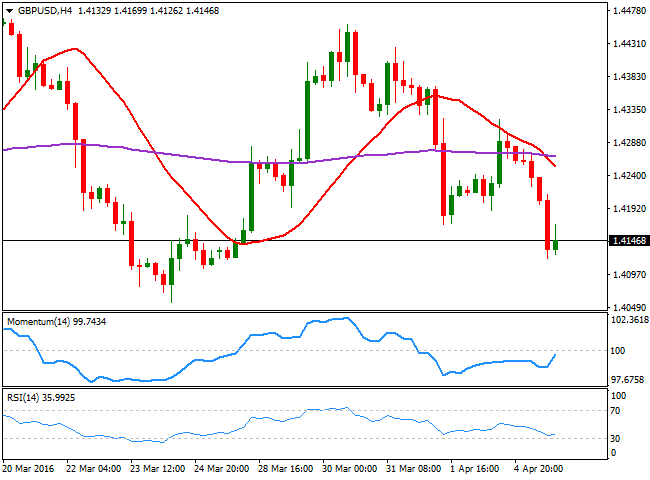
The British Pound resumed its decline against the greenback, falling down to 1.4121 as investors dumped the weakened high yielder in a risk aversion environment. The UK released its services PMI for March, up to 53.7, beating expectations of 53.5 and above February's reading of 52.7. With almost no changes in the manufacturing and construction PMIs, the overall composite index rose to 53.6 in March from the previous 52.7. The news, however, were not enough to support the Pound, as market traded mostly on sentiment. Technically, the 1 hour chart shows that the technical indicators keep heading south near oversold levels as the 20 SMA turned sharply lower above the current level, now around 1.4210, maintaining the risk towards the downside. In the 4 hours chart, the 20 SMA is extending below the 200 EMA in the 1.4260/70 region, while the technical indicators have managed to post a tepid bounce from oversold readings, but remain well into the red. The price is now being capped by short term selling interest around 1.4170, last Friday's low and the immediate resistance. Nevertheless, it will take a steeper recovery beyond 1.4250 to revert the current negative tone and see the pair attempting to regain the 1.4300 figure.
Support levels: 1.4115 1.4080 1.4035
Resistance levels: 1.4170 1.4210 1.4250
USD/JPY
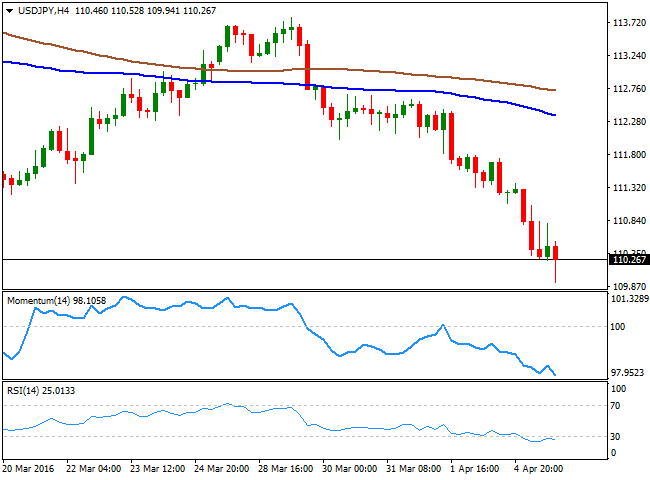
The Japanese yen rallied to a fresh 18month high against the greenback, with the USD/JPY reaching 109.94 before bouncing some. The catalyst for yen's gains was the release of poor local data, as the March Nikkei PMI showed that the composite index fell to 49.9, below 50 for the first time this year. The services reading fell down to 50.0, also the lowest for the year. Adding to poor data was BOJ's Governor Kuroda, saying in a parliament committee that monetary policy can’t solve all economic issues, but also adding that he is willing to cut rate further. Nevertheless the initial headline sent local share markets down, and the negative mood prevailed all through the day. The bearish potential has gathered momentum, and the pair can now extend its decline down to 106.20 during the upcoming days, a major static long term support. In the meantime, the 1 hour chart shows that the technical indicators have corrected extreme oversold reading but remain well into the red, as the 100 SMA accelerated its decline well above the current level. In the 4 hours chart, the technical indicators keep heading lower, despite being in extreme oversold territory, in line with a continued decline for this Wednesday.
Support levels: 109.90 109.50 109.10
Resistance levels: 110.70 111.20 111.60
GOLD
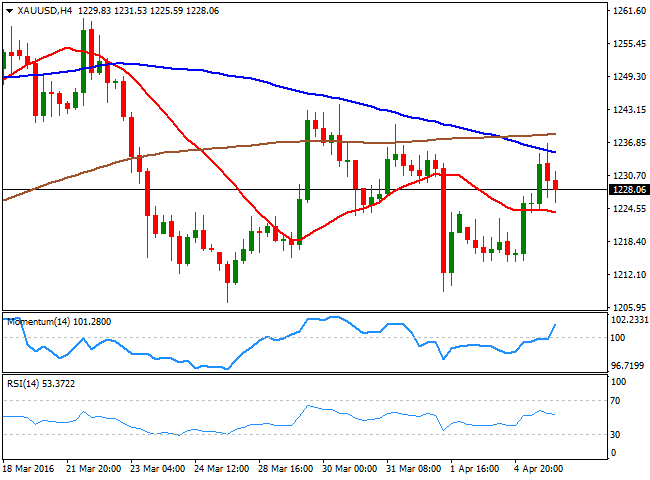
Gold prices were up this Tuesday on safe haven demand triggered by renewed concerns on global growth. The bright metal staged a nice comeback as equities plummeted worldwide, with spot gold reaching a daily high of $1,236.80 a troy ounce during the European session, as tepid growth figures in the EU and the UK spurred concerns during London trading hours. The commodity, however, retraced partially as Wall Street pared losses, ending the day around 1,228.50. The daily chart shows that the commodity was once again contained by a bearish 20 SMA, currently around the mentioned daily high, whilst the technical indicators have turned back higher, but remain within bearish territory. In the shorter term, and according to the 4 hours chart, the pair presents a limited upward potential, given that the price is developing above a horizontal 20 SMA, while the Momentum indicator heads north within positive territory, but the RSI indicator already turned south and stands around 52, indicating the commodity may resume its decline, particularly on a break below 1,222.70, the immediate support.
Support levels: 1,222.70 1,214.70 1.208.90
Resistance levels: 1.236.80 1,242.50 1,251.90
WTI CRUDE
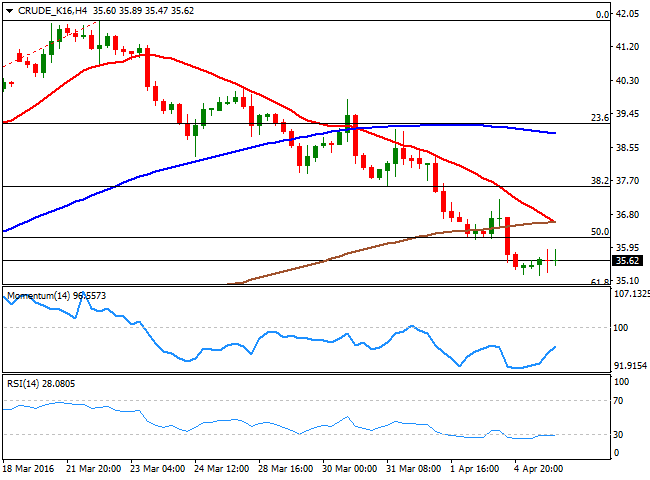
Crude oil prices held steady on Tuesday, trading near a fresh low set at $35.23, as Kuwait cooled things down, saying that an output freeze by major oil producers would proceed even without Iran, shifting market's attention towards the Doha meeting next April 17th. West Texas Intermediate crude oil prices closed a few cents above the mentioned daily low after a choppy session, and the daily chart shows that the bearish pressure eased, but didn't reverse, as the technical indicators have turned slightly higher near oversold territory, but the price remained well below a now bearish 20 SMA. In the 4 hours chart, the RSI indicator heads north around 35, while the Momentum indicator also heads higher below its 100 level, as the 20 SMA accelerated its decline and after crossing below the 100 SMA, is pointing to break below the 200 SMA too, indicating the risk remains towards the downside, particularly on a break below 34.85, the immediate support.
Support levels: 34.85 34.30 33.50
Resistance levels: 36.20 36.90 37.65
DAX
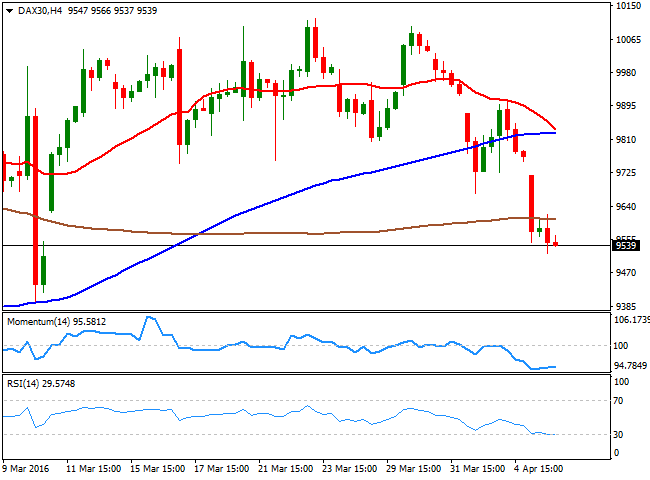
European equities fell strongly this Tuesday, tracking Asian shares' losses and after a series of disappointing European economic figures. The German DAX fell 251 points or 2.63% to close at 9,563.36 with industrial orders in the EU's largest economy down in February by 1.2%, as foreign demand weakened, whilst the final local services PMI for March printed 55.1 against 55.5 previous. The German benchmark fell to its lowest since March 10th, confirming, with this latest decline, a bearish trend. Technically, the daily chart supports a downward continuation as the indicators maintain their strong bearish slopes after breaking below their midlines, as the index has now moved far away below its 100 and 200 SMAs, and the 10,000 figure. In the shorter term, the index is also biased lower, as the technical indicators are currently consolidating within oversold levels as the benchmark pressures its lows, while developing below all of its moving averages.
Support levels: 9,507 9,430 9,348
Resistance levels: 9,618 9,693 9,765
DOW JONES
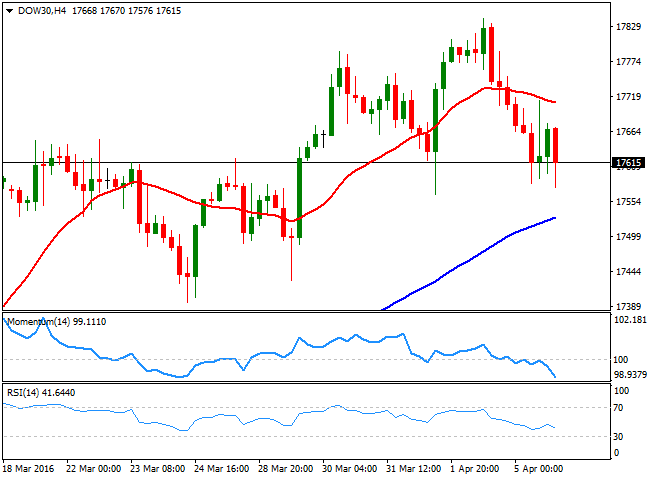
Wall Street edged lower for a second day inarow, as renewed fears over a global economic slowdown sent investors away from high yielders and put safe havens on demand. The DJIA posted its largest 1day decline in over a month, shedding 133 points to close at 17,603.46. The Nasdaq closed at 4,843.93, down by 47 points, whilst the SandP lost 1.01%, to end at 2,045.17. The daily chart for the index shows that it is still holding above its 20 SMA, currently acting as the immediate dynamic support at 17,551, while the Momentum indicator is about to cross its midline towards the downside. In the same chart, the RSI indicator has begun to correct oversold readings, and heads south around 62. Shorter term, the 4 hours chart presents a strong bearish tone, given that the index has extended below its 20 SMA, whilst the technical indicators head sharply lower near oversold levels, in line with the longer term outlook.
Support levels: 17,551 17,483 17,421
Resistance levels: 17,677 17,750 17,841
FTSE 100
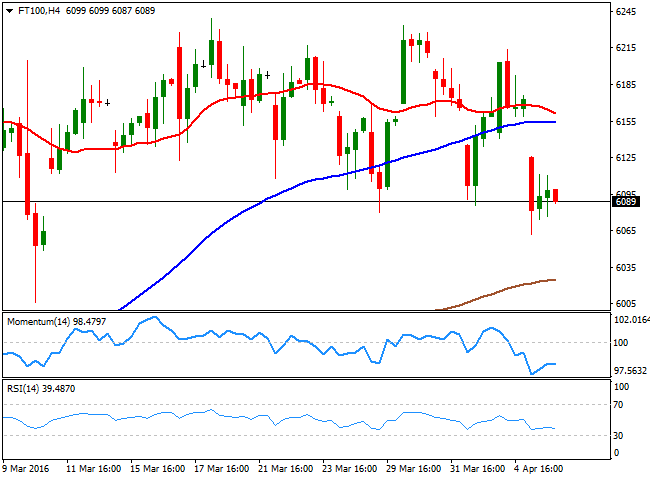
The FTSE 100 fell to a fresh 3week low as investor sentiment soured in the Asian session, and the negative mood extended all through the day. The Footsie closed 1.19% lower at 6,091.23, with commodity related shares leading the decline. Oil´s weakness sent Royal Dutch Shell down 2.16% while BP shed 2.1%. Mining giants were also lower, with Rio Tinto plummeting 2.43% and BHP Billiton shedding 4.57%. The daily chart shows that the index is now in risk of further declines, as it´s currently struggling around its 100 DMA, whilst the technical indicators have extended their declines below their midlines, and the index holds near its daily low. In the 4 hours chart, is clearly that the index has finally broken its latest range towards the downside, as it trades below its previous lows, whilst the technical indicators are now heading south within bearish territory, finally detaching from their midlines.
Support levels: 6,006 5,939 5,870
Resistance levels: 6,110 6,162 6,228
The information set forth herein was obtained from sources which we believe to be reliable, but its accuracy cannot be guaranteed. It is not intended to be an offer, or the solicitation of any offer, to buy or sell the products or instruments referred herein. Any person placing reliance on this commentary to undertake trading does so entirely at their own risk.
Recommended Content
Editors’ Picks
EUR/USD trades above 1.0700 after EU inflation data

EUR/USD regained its traction and climbed above 1.0700 in the European session. Eurostat reported that the annual Core HICP inflation edged lower to 2.7% in April from 2.9% in March. This reading came in above the market expectation of 2.6% and supported the Euro.
GBP/USD recovers to 1.2550 despite US Dollar strength

GBP/USD is recovering losses to trade near 1.2550 in the European session on Tuesday. The pair rebounds despite a cautious risk tone and broad US Dollar strength. The focus now stays on the mid-tier US data amid a data-light UK docket.
Gold price remains depressed near $2,320 amid stronger USD, ahead of US macro data

Gold price (XAU/USD) remains depressed heading into the European session on Tuesday and is currently placed near the lower end of its daily range, just above the $2,320 level.
XRP hovers above $0.51 as Ripple motion to strike new expert materials receives SEC response

Ripple (XRP) trades broadly sideways on Tuesday after closing above $0.51 on Monday as the payment firm’s legal battle against the US Securities and Exchange Commission (SEC) persists.
Mixed earnings for Europe as battle against inflation in UK takes step forward

Corporate updates are dominating this morning after HSBC’s earnings report contained the surprise news that its CEO is stepping down after 5 years in the job. However, HSBC’s share price is rising this morning and is higher by nearly 2%.