EUR/USD
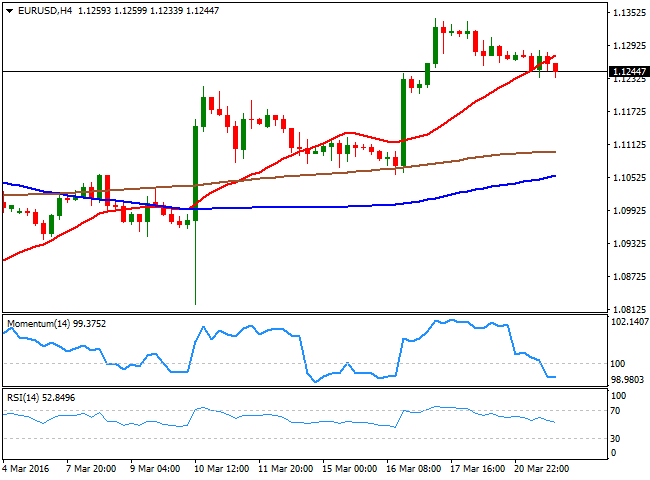
FED's officers underpinned the greenback, as Williams and Lockhart, in different speeches and separated events, opened doors for a rate hike in the US Central Bank upcoming April meeting. After the US Federal Reserve offered a dovish surprise last week, investors were pricing in quite a limited possibility for a June rate hike, with most expecting no action until September. The greenback's bearish case developed after the latest FOMC announcement, with the currency plummeting to multimonth lows across the board, and despite latest wording from policy makers, a reversal is far from confirmed. Early Monday, the EU released its latest current account data, which resulted below market's expectations, by printing a surplus of €25.4B, down from a previously revised €28.6B. In the US, housing data disappointed as Existing Home sales plummeted 7.1% in February, down to a seasonally adjusted annual rate of 5.08M. The EUR/USD pair traded as low as 1.1233, and remained nearby by the end of the US session, having met selling interest on approaches to the 1.1285 level, ever since the day started. The lack of volume has left intraday technical readings with no actual momentum, but generally speaking, the downside is now favored, given that in the 1 hour chart, the price has been driven lower by a bearish 20 SMA, whilst the technical indicators remain below their midlines. In the 4 hours chart, the price has extended below a bearish 20 SMA during the US session, while the RSI indicator heads south around 52 and the Momentum turned horizontal after a strong break below its 100 line, supporting a test of the 1.1200 figure and even a break below it for this Tuesday.
Support levels: 1.1200 1.1160 1.1120
Resistance levels: 1.1285 1.1310 1.1340
GBP/USD
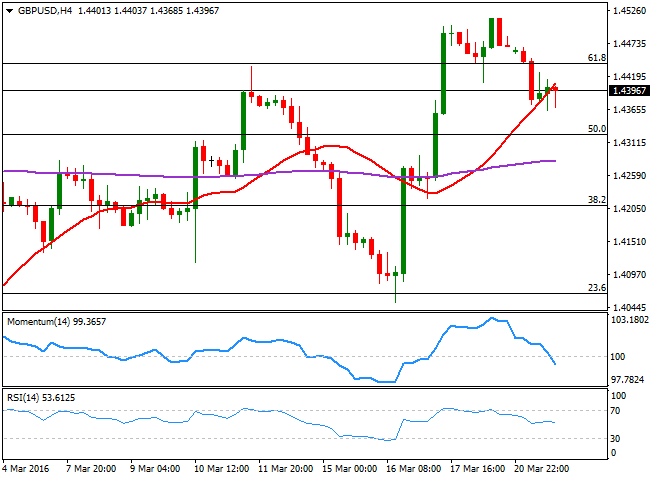
The GBP/USD pair returned below a major Fibonacci level, the 61.8% retracement of this year's decline, on the back of dollar's strength, having failed to rally beyond it for two straight days. Fears of a Brexit are still a factor of longerterm pressure for the local currency, but this retracement at the beginning of the week, may well be blamed to profit taking ahead of key macroeconomic releases in the UK this Tuesday, including inflation figures for last February. The market is expecting to see a rise in the headline CPI from 0.3% to 0.4% while the core reading is projected to hold steady at 1.2%. Producer input prices are expected to post a limited bounce also, but to remain mostly within negative territory. Better than expected figures may help the Sterling, but at this point, a steady advance beyond 1.4500 is required to confirm a continued advance. In the meantime, the short term technical picture is bearish, as in the 1 hour chart, the price develops below a bearish 20 SMA, while the technical indicators have turned flat within negative territory, having corrected from near oversold levels. In the 4 hours chart, the technical indicators head lower, with the Momentum indicator almost vertically, whilst the price remains stuck around a bullish 20 SMA, all of which is not enough to confirm a bearish breakout.
Support levels: 1.4365 1.4325 1.4280
Resistance levels: 1.4410 1.4445 1.4490
USD/JPY
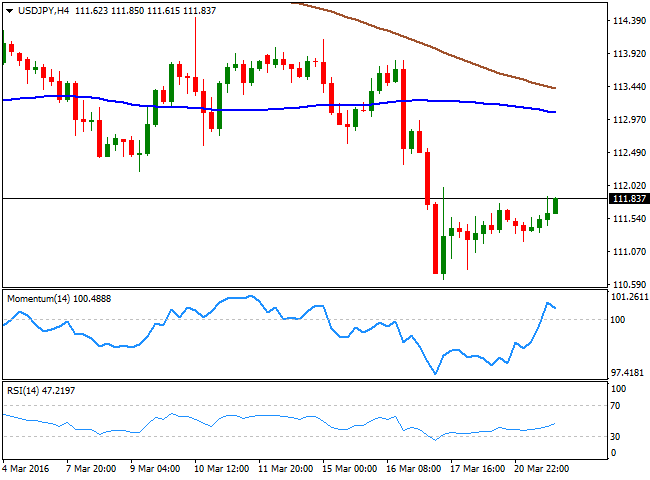
The USD/JPY pair gained a firmer tone in the American afternoon, finding support in rising stocks, albeit the intraday rally was limited and the pair remains below the critical 112.00 level, the highest post after bottoming at 110.66 last week. With Japanese markets closed due to a local holiday, the JPY saw little action during the first half of the day, with the pair stuck to the 111.45 area, lately ignoring poor macro data coming from the US. Japan will release its Nikkei Manufacturing PMI for March during the upcoming Asian session, expected at 50.6 from previous 50.1 and a reading below expected should fuel the ongoing advance, not only because of the local economic weakening, but also on increasing hopes of further easing coming from the BOJ. Technically, the 1 hour chart shows that the price remains below a bearish 100 SMA, currently at 112.10, while the technical indicators have lost upward strength after recovering positive ground. In the 4 hours chart, the Momentum indicator has turned south above the 100 level, while the RSI indicator heads higher around 46, all of which continues to limit the possibility of a stronger advance.
Support levels: 111.60 111.30 111.00
Resistance levels: 112.10 112.45 112.90
GOLD
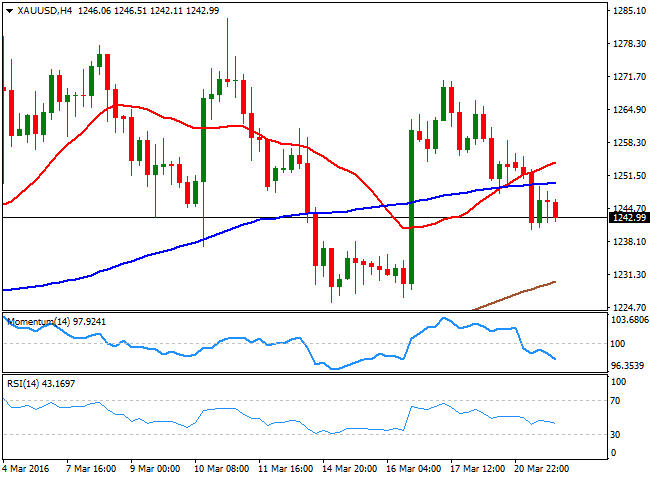
Gold prices retreated further this Monday, down for second day inarow, and with spot down to $1,240.59 a troy ounce, ending the day around $1243.00. Speculators kept taking profits out of the metal, also on the back of improving risk appetite and a rising dollar. The yellow metal closed the day below the psychological level of 1,250.00, but remains above pre FED levels, as bulls remain in the driver's seat, with the dominant bullish trend largely intact. Technically, the daily chart shows that the commodity is ending the day below its 20 SMA while the technical indicators turned south, suggesting the downward move may extend further. In the shorter term, the 4 hours chart is also presenting a bearish tone, as the price has consolidate for most of the day below its 20 SMA, while the technical indicators present strong bearish slopes below their midlines. The metal has found a strong support around 1,225.00 ever since the month started, bouncing multiple times from the level that can be revisited this Tuesday, should the dollar keep gaining. Nevertheless, buyers will likely surge on approaches to this region, and maintain the downside limited.
Support levels: 1,240.50 1,233.15 1.225.00
Resistance levels: 1,248.30 1,254.40 1,265.40
WTI CRUDE
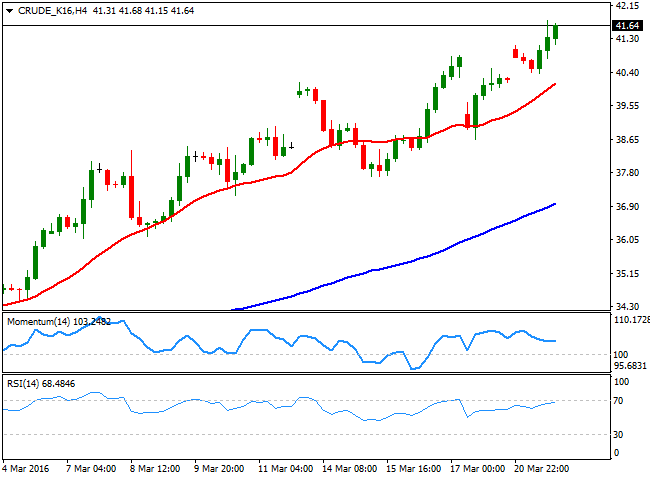
Crude oil prices trimmed its latest losses and extend their rallies to fresh highs during the American afternoon, with West Texas Intermediate crude oil futures up to $41.78 a barrel. Data coming from the US showed a drawdown at the Cushing, Oklahoma delivery hub, with crude stockpiles falling by 570,574 barrels to 69.05 million in the week to March 18th. Fears that stockpiles can hit capacity have diminished after the news, boosting prices in spite of dollar's strength. The commodity's daily chart shows that the price has accelerated beyond its 200 DMA for the first time in the year, while the 20 DMA has advanced further above the 100 DMA, a strong upward continuation sign. In the same chart, the technical indicators have lost upward momentum, but remain near overbought levels, supporting some consolidation before a new leg higher. In the 4 hours chart, the price advanced further above a clearly bullish 20 SMA, whilst the RSI indicator heads north around 68, in line with the longer term outlook.
Support levels: 41.15 40.60 40.10
Resistance levels: 41.75 42.50 43.20
DAX
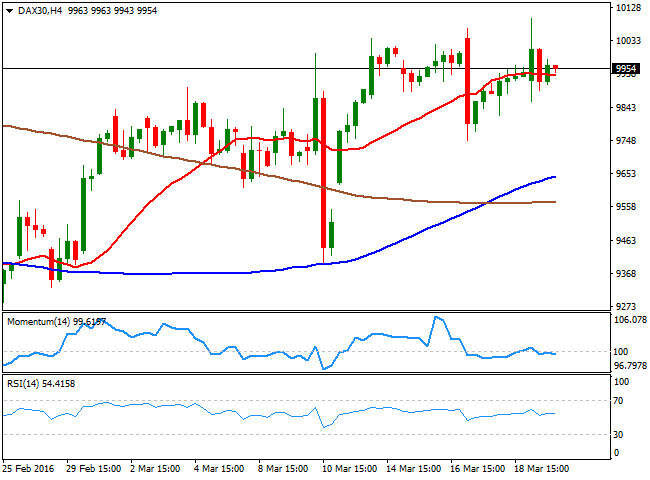
European equities closed in the red this Monday, although having erased most of their daily losses as oil pared losses. The German DAX closed day 2 points lower at 9,948.64, in spite of strong intraday gains posted by Bayer, up 4.6% following reports that Monsanto is studding a possible deal with the company. Automakers led the way higher, but the banking sector closed in the red. The German benchmark briefly advanced beyond the 10,000 level, but retreated quickly, still looking limited towards the upside due to its inability to rally beyond the critical level. In the daily chart, the index is well above a bullish 20 SMA, while the technical indicators have lost upward strength, but remain above their midlines. In the same chart, the 100 DMA is now offering a strong dynamic resistance around 10,060. Shorter term, the index presents a neutral tone, as in the 4 hours chart, it has been hovering around a horizontal 20 SMA, whilst the technical indicators head nowhere around their midlines.
Support levels: 9,891 9,839 9,773
Resistance levels: 10,010 10,060 10,118
DOW JONES
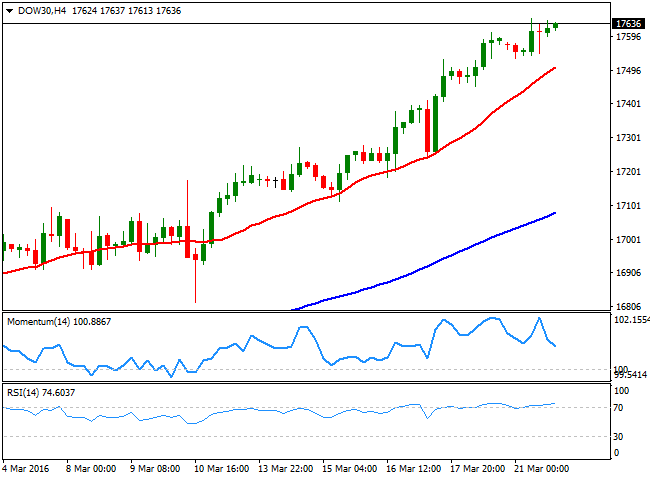
US indexes posted some modest advances this Monday, extending their fiveweek rally in a choppy trading day. The DJIA added 21 points to close at 17,623.87, the Nasdaq added 13 points to end at 4,805.87, while the SandP added just two points to 2,051.60. The indexes hovered within gains and losses for most of the day, finally finding support in oil's recovery. Nevertheless, comments from US FOMC officials have put investors in cautious mode, and wouldn't surprise if stocks retreat this Tuesday on profit taking. The daily chart shows that the RSI indicator keeps heading north, despite being around 77, while the Momentum indicator has barely retreated from overbought levels. In the same chart, the 20 DMA has accelerated its advance after crossing above the 100 and 200 DMAs, all of which supports some continued advance for the upcoming sessions. Shorter term and according to the 4 hours chart, the upside remains also favored, with the index well above its moving averages and the RSI indicator with a mild bullish slope at 74.
Support levels: 17,596 17,533 17,449
Resistance levels: 17,644 17,728 17,800
FTSE 100
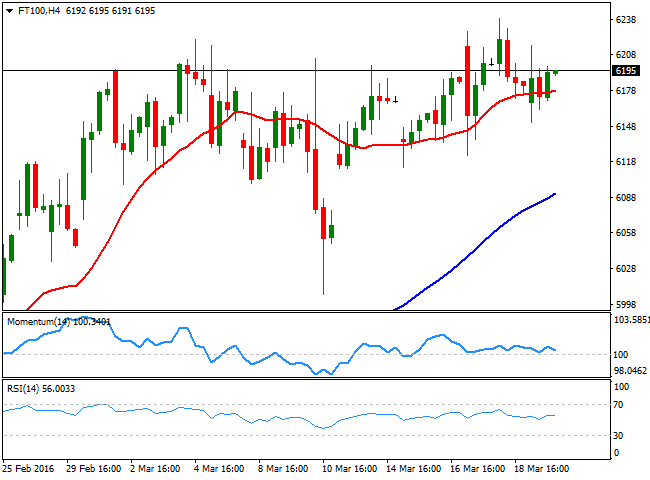
The FTSE 100 edged 0.08% lower this Monday, to end the day at 6,184.58 weighed by lower commodities' prices. Mining shares led the way lower, with Antofagasta shedding 3.6%, Anglo American down 1.1% and Glencore losing 0.6%. The London benchmark continues hovering near the 6,200 region, but volume around the index has been quite low for the past month, leaving the daily chart with a neutraltobullish stance in the daily chart. The index is still developing above a bullish 20 SMA in the mentioned time frame, but the technical indicators continue diverging lower, with no actual momentum and within positive territory. In the 4 hours chart, the technical picture is neutral, with the technical indicators having made no progress and the index still moving back and forth around a flat 20 SMA. At this point, some follow through beyond 6,268, the 200 DMA, is required to confirm a more constructive scenario.
Support levels: 6,112 6,075 6,037
Resistance levels: 6,239 6,268 6,326
The information set forth herein was obtained from sources which we believe to be reliable, but its accuracy cannot be guaranteed. It is not intended to be an offer, or the solicitation of any offer, to buy or sell the products or instruments referred herein. Any person placing reliance on this commentary to undertake trading does so entirely at their own risk.
Recommended Content
Editors’ Picks
EUR/USD clings to gains above 1.0750 after US data

EUR/USD manages to hold in positive territory above 1.0750 despite retreating from the fresh multi-week high it set above 1.0800 earlier in the day. The US Dollar struggles to find demand following the weaker-than-expected NFP data.
GBP/USD declines below 1.2550 following NFP-inspired upsurge

GBP/USD struggles to preserve its bullish momentum and trades below 1.2550 in the American session. Earlier in the day, the disappointing April jobs report from the US triggered a USD selloff and allowed the pair to reach multi-week highs above 1.2600.
Gold struggles to hold above $2,300 despite falling US yields

Gold stays on the back foot below $2,300 in the American session on Friday. The benchmark 10-year US Treasury bond yield stays in negative territory below 4.6% after weak US data but the improving risk mood doesn't allow XAU/USD to gain traction.
Bitcoin Weekly Forecast: Should you buy BTC here? Premium

Bitcoin (BTC) price shows signs of a potential reversal but lacks confirmation, which has divided the investor community into two – those who are buying the dips and those who are expecting a further correction.
Week ahead – BoE and RBA decisions headline a calm week

Bank of England meets on Thursday, unlikely to signal rate cuts. Reserve Bank of Australia could maintain a higher-for-longer stance. Elsewhere, Bank of Japan releases summary of opinions.
