EUR/USD battles with 50-day SMA as rebound strengthens [Video]
![EUR/USD battles with 50-day SMA as rebound strengthens [Video]](https://editorial.fxstreet.com/images/Markets/Currencies/Majors/EURUSD/piggy-bank-with-falling-coins-gm505796756-79269379_XtraLarge.jpg)
EUR/USD battles with 50-day SMA as rebound strengthens
EURUSD has been losing ground since the beginning of the year, creating a clear structure of lower highs and lower lows within a descending channel. Nevertheless, after managing to find its feet at the 20-year low of 0.9863, the pair is pushing for some recovery, currently challenging the 50-day simple moving average (SMA).
The momentum indicators also suggest that bullish forces have gained the upper hand. Specifically, the RSI has jumped above its 50-neutral mark, while the stochastic oscillator is ascending into the overbought area.
Should buying pressures intensify and the price profoundly cross above its 50-day SMA, initial resistance could be encountered at the 1.019 hurdle, taken from the pair’s descending trendline. Conquering this barricade, the bulls could aim for 1.0290 before the July peak of 1.0368 comes under examination. Even higher, the 1.0614 resistance zone could prove to be a tough one for the pair to overcome.
On the flipside, bearish actions could send the price to test the recent resistance region of 1.0093. Sliding beneath that floor, the spotlight may turn to parity, which is considered a crucial psychological mark by markets. A violation of the latter could pave the way for the 20-year low of 0.9863.
In brief, EURUSD is attempting a rebound but the road to complete recovery remains long. Therefore, initial steps will be taken if the price clearly closes above its 50-day SMA.
-637985703001228515.png)
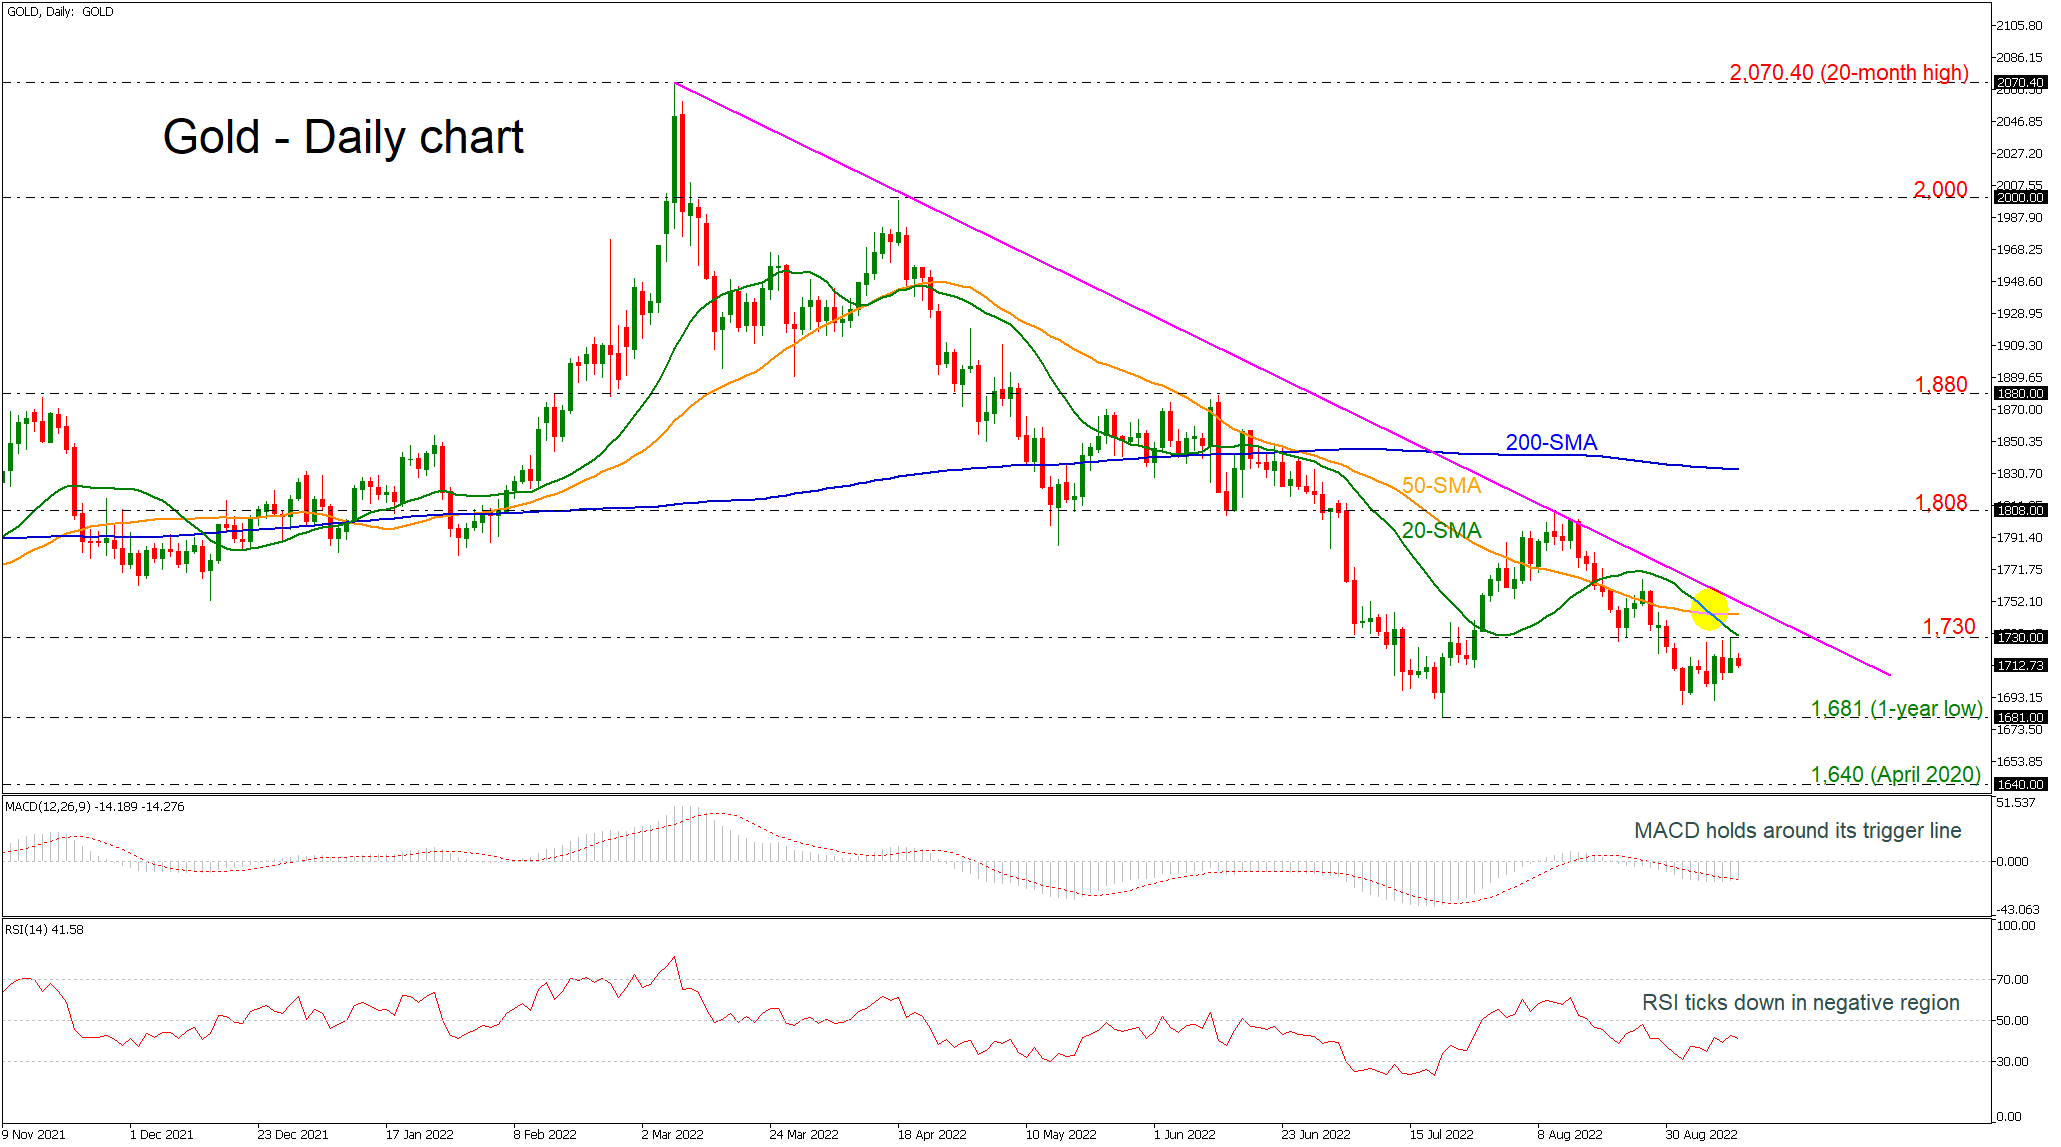
Gold remains under pressure
Gold remains under pressure and risk is still to the downside as prices continue to drift lower from the long-term descending trend line. The technical indicators are bearish and point to more weakness in the market.
Looking at the daily chart, gold prices are looking capped by the 20 and 50-day simple moving averages which are negatively aligned after a bearish crossover that took place in the preceding week. The RSI indicator is ticking lower in the bearish territory; however, the MACD is trying to overcome its trigger line in the negative region.
The next target to the downside is the one-year low of 1,681. At this stage the market would likely see a resumption of the downtrend from the 20-month peak of 2,070.40 and put in place a lower low at 1,640, registered in April 2020.
Upside moves are likely to find resistance at the 1,730 barrier, which overlaps with the 20-day SMA. There is an important resistance zone between the 40-day SMA at 1,744 and the downtrend line around 1,755. Rising above this area would help shift the focus to the upside towards 1,808. Breaking this level could see a re-test of the 200-day SMA at 1,833 and turn the bias to bullish.
In the short- and long-term timeframes, the bearish phase remains in play especially if gold prices continue to trade below the downtrend line and the 200-day SMA.
Author

Melina joined XM in December 2017 as an Investment Analyst in the Research department. She can clearly communicate market action, particularly technical and chart pattern setups.


