Eurodollar futures signal bleak economy on the horizon

Many believe the yield curve, despite its flattening cannot be giving off an accurate signal because the Fed is buying bonds via QE, therefore it must be distorted. I can assure that is not the case, because rates move independent of the Fed, but let’s leave that for another time. The Eurodollar futures curve has been giving off similar signals to that of the yield curve. The Fed is NOT active in the Eurodollar futures market, therefore by the logic used above, its signals cannot be distorted. But, let me tell you who is active in the Eurodollar futures market: global dealer banks (a dealer bank buys and sells govt debt securities) – they represent the shadow money system (dollars outside of the Fed’s purview and outside of the money supply metrics). As time has gone on, these global dealer banks have been pricing in more and more deflationary potential – meaning, weaker growth and lower levels of inflation. But, before we get there, what are Eurodollar futures?
Those familiar with my articles know that Eurodollars have nothing to do with the EUR/USD exchange rate. Eurodollars are simply US dollars that are held outside of the United States. Now, Eurodollar futures are derivative contracts. A derivative is a product that derives (obtains) its value from something else. That something else in this case is LIBOR or London Inter-Bank Offering Rate. LIBOR is a 3-month interest rate – the rate you would earn to hold a US dollar in a bank outside of the US. It is similar to the Federal Funds market, because it is a market where financial entities can obtain an unsecured loan and the LIBOR rate is used as the borrowing interest rate. Unlike the Fed Funds Rate which is a domestic (in the US) rate, LIBOR is used by global, offshore (outside the US) banks. When global banks borrow from each other, they use the LIBOR rate or they use it as a benchmark for an agreed upon rate between the transacting parties. LIBOR does track the Federal Fund’s Rate pretty closely, and therefore projections of the Fed’s monetary policy, but it is important to note that the Fed has no authority in this market or in setting the LIBOR rate, like they do with the Fed Funds Rate.
Eurodollar futures price reflect the market expectations of the interest rate (LIBOR) on three month eurodollar deposits (dollars held outside the US). The settlement on Eurodollar futures contracts is determined by 3-month LIBOR, on the last trading day of the Eurodollar futures contract (contracts can be closed prior to settlement if a party is found willing to engage in an offsetting transaction). The price of a Eurdollar futures contract is either 100 or below (it can never go above 100). To determine the LIBOR rate that the Eurodollar futures contract is pricing in, you simply take 100 and subtract it from the price of the contract. If the price of the contract is 100, then the LIBOR rate would 0%. Another example, if the price of a 1-year Eurodollar futures contract is 99, then that means the market is pricing in the LIBOR rate to be at 1% in a year from now. Let’s say a month down the road, the contract price rises to 99.50, that means the market is now pricing in LIBOR to be at 0.50%. The rate fell from 1% to 0.50%, therefore, the Eurodollar futures contract would be pricing in tighter money conditions in the future. Whereas, if the contract price fell from 99 down to 98.50, the LIBOR rate the contract would be pricing in, rose from 1% up to 1.50%. This situation would be pricing in looser money conditions in the future. So, as a global dealer bank is looking to hedge against falling interest rates (tighter money), they would bid up the price of Eurodollar futures contracts, pricing in a lower future LIBOR rate and vice versa. Note, that even though LIBOR is a 3-month rate, the future rate is constantly fluctuating and each Eurodollar futures contract is 1 month in duration. There are many different types of contracts however, for instance you could “pack” or “bundle” a series of 3-month contracts together to trade. And the contracts go out until 10 years in the future. However, it is not necessary at all to get into the mechanics of this in order to fully understand the signals this market is giving you.
To make it even simpler, think of the Eurodollar futures market like the US Treasury market. In the US Treasury market, you have the price of a bond and the yield associated with that specific maturity, and those two (price and yield) have an inverse relationship with one another – prices rise, yields fall and if prices fall, yields rise. The Eurodollar futures market isn’t much different. There is the price of a contract and the 3-month LIBOR rate that can be easily determined just by taking 100 and subtracting it from the price of the contract. Therefore, just like bond yields, Eurodollar futures contracts and future LIBOR rates have an inverse relationship. In the Treasury market, banks, investors, etc. buy bonds, (which push up bond prices and cause yields to fall) when there is deflationary/disinflationary and weak growth potential. Put another way, when money is tight or tightening, investors seek out safe, liquid assets. And as a bank, you want to hoard Treasuries under tight or tightening money conditions because Treasuries are used as collateral to obtain dollar funding in the repo and derivative markets. Now, Eurodollar futures contracts are not used as collateral in funding markets, but they can be used to hedge against fluctuations in interest rates – remember yields falling = tight or tightening money and yields rising = loose or loosening money. So, if global dealer banks (those that represent the shadow money system), see money getting tighter, they will buy a Eurodollar futures contract which will push up the price of the contract, and consequentially, the future price of the LIBOR rate will fall – just like the Treasury market, falling rates = tight or tightening money conditions and rising rates = loose or loosening money conditions.
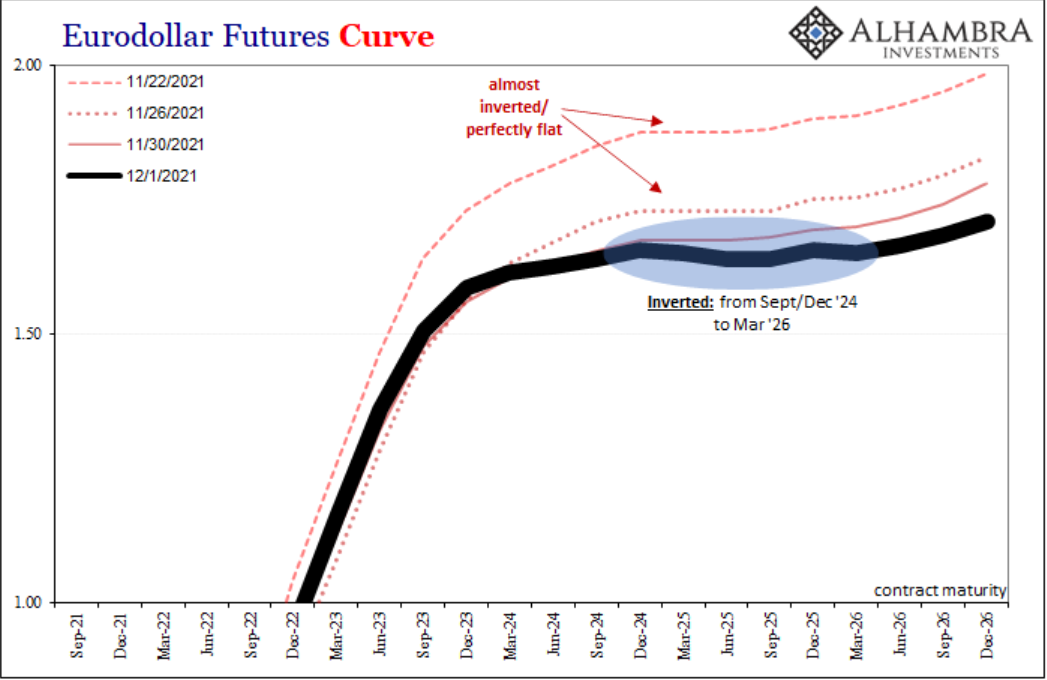
Okay, now that we have a basic understanding of the Eurodollar futures market, let’s get into what the market has been signaling to us. Just like the bond market, since we can determine the potential future price of rates in the Eurodollar futures market, we can also construct a curve, just like a yield curve but instead it’s a Eurodollar futures curve. Fortunately for the sake of simplicity, both the Eurodollar futures curve and a yield curve are interpreted in the exact same way. If you are unfamiliar with how curves work, I wrote about what the yield curve is and why it’s important for banks, here and more recently, what the yield curve is currently signaling to us about the monetary system, here. Just like the yield curve, the front-end of the Eurodollar futures curve is heavily influenced by the Fed’s future monetary policy decisions. The Fed has recently taken a more hawkish stance towards monetary policy because they believe the labor market is tightening and inflation is no longer transitory. So, the Fed has decided to start tapering its QE bond purchases and are looking to raise rates sooner than initially anticipated. Because of this, the front-end of both the yield curve and the Eurdollar futures curve have become very steep (angled upwards). If you look below, I have a chart of both the yield curve and Eurodollar futures curve, depicting the steepness of the front-end (black line on yield curve, gray line on Eurodollar futures curve). The upward sloping curve on the short-end is telling us that the market expects higher rates in the future due to the upcoming tightening of the Fed’s monetary policy.
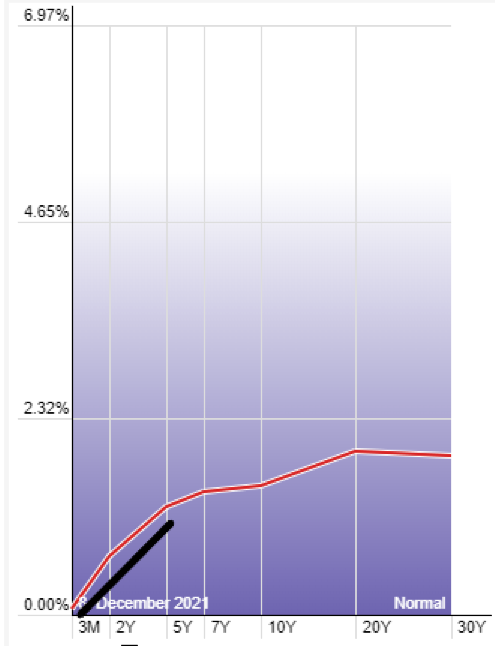
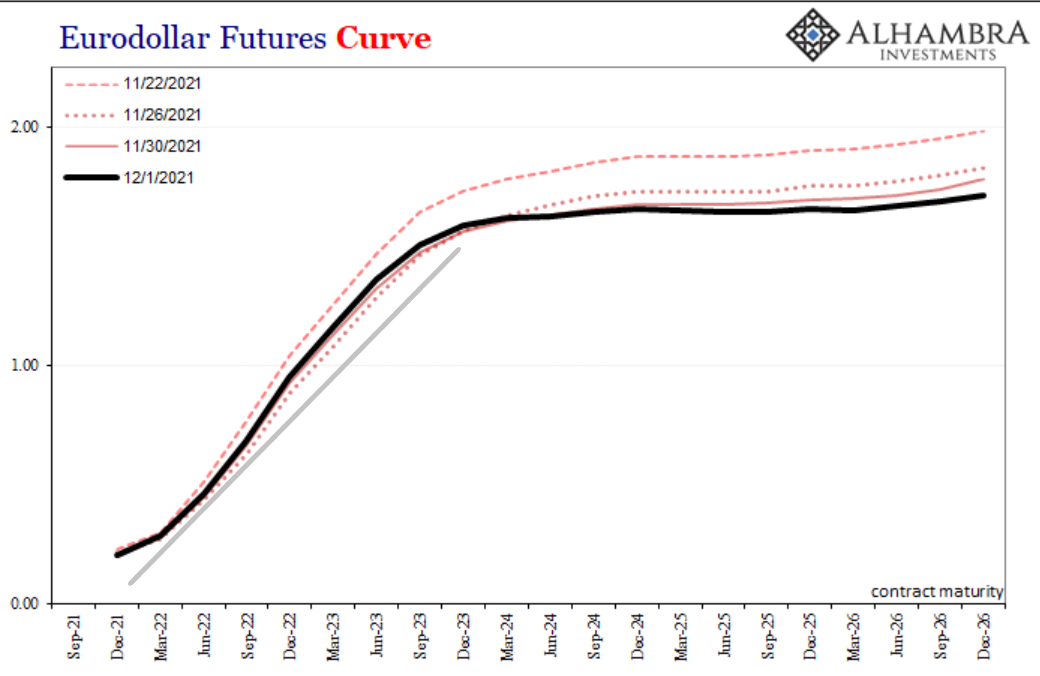
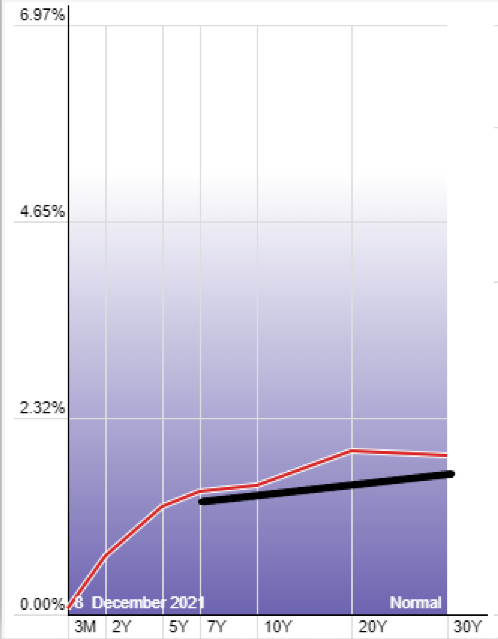
Again, just like the yield curve the further out you go, the less the Fed’s monetary policy influences it. So, on the Eurodollar futures curve, once you get to the 3-year, it becomes less influenced by monetary policy and more influenced by long-term growth and inflation expectations. Think of the long-end of the Futures curve as like a correcting mechanism – it tells us whether the Fed’s policy and their outlooks on the economy are warranted or not, because again, the long-end moves on long-term growth and inflation expectations, not what the Fed is or isn’t doing. If you look below at the long-end of the futures curve (first chart) and yield curve (second chart) they are both flat. The 3-year through to the 5-year are pricing in about the same LIBOR rate in the future. The 5-year through the 30-year on the yield curve are also pricing in lower long-term rates. This is a signal of tight or tightening money conditions, and thus, lower growth and inflation expectations. If money was loose or loosening, it would be reflected in Eurodollar futures by the 4-year being a lot higher than the 3-year, and the 5-year being even higher than the 4-year. This is because loose or loosening money conditions would substantially increase the chances of economic growth and inflation in the future, thus increasing yields and steepening the curve. Clearly, the opposite is true. The Eurodollar futures curve is not only telling us that money is tight or tightening and the chances of long-term growth and inflation is bleak, it is also telling us that the Fed tightening monetary policy is not warranted. Some may say the Fed is making a policy “error”. The curve is speaking clearly, telling us deflationary potential and weak growth is likely in the future, therefore we are headed in that direction regardless of whether the Fed tightens monetary policy or not. So, the Fed tightening monetary policy isn’t the reason for the direction we are headed (therefore not a policy “error” in a practical sense) but the Fed raising rates could certainly be the trigger to a deflationary bust and/or exacerbate the downturn. So, it’s not so much a policy “error”, as it is an error in the Fed’s ability to accurately forecast the direction our economy is headed.
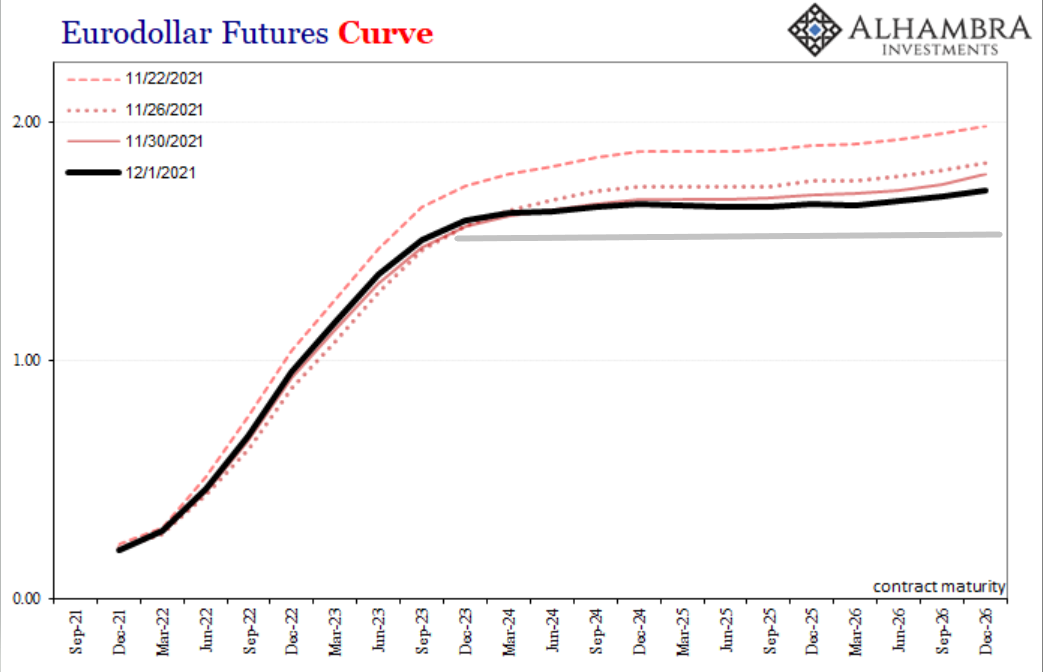
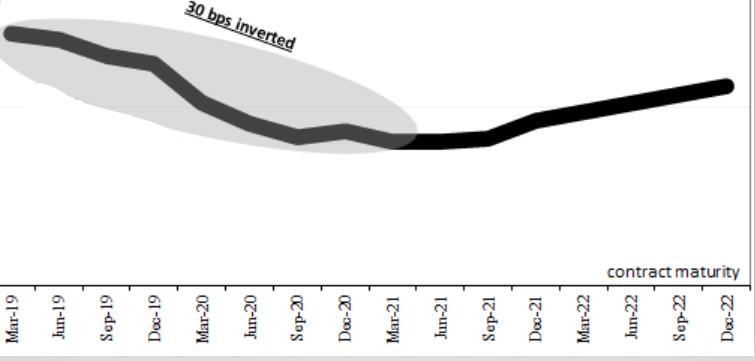
If we look (below, first chart) even closer at the Eurodollar futures curve, it has actually inverted. An inverted curve is when at least one part of the longer-end of the curve has moved below a shorter-end of the curve. In this case, the March 2025 and 2026 rates have moved below the rates on the December 2023 out to the December 2024 contracts. In the mainstream, there is always a lot of attention when the yield curve inverts, particularly when the 10-year yield moves below the 2-year yield. The mainstream interprets this as a signal of an incoming recession. Now, a curve inverting does not trigger a recession. The flattening of the curve like we have been seeing over the past few months is telling us that monetary and economic conditions are worsening, the economy is slowing, and the chance of a recession is increasing. What an inverted curve tells us, is that conditions have gotten so bad under the surface, that dealer banks (and other market participants) are willing bid up the long-end of the curve to extremes, so much, that it pushes its yields below the shorter-end. So, it’s not the inverted curve itself, rather what it tells us about the state of the monetary system that is so troublesome. The current inversion is a tiny one, only a few bps, but an inversion is still a worrisome signal. And the longer is persists, the stronger the signal because it means global dealer banks are not switching their stance on future monetary conditions, they are continuing to bid up the long-end telling us money is not loosening but remaining tight. So, pay attention to the inversion persisting, and potentially getting worse like it did in 2019 (see below, second chart), preceding the March 2020 recession by several months. Jeff Snider of Alhambra Partners said it best on December 2nd, “Put it this way: if it takes quite a lot of bad vibes just to get the curve, any curve, inverted just the bare minimum (like yesterday) in the first place, what level of pessimism, skepticism, and downright risk aversion must there be hidden from within the shadows to keep it there for any length of time at any depth?”
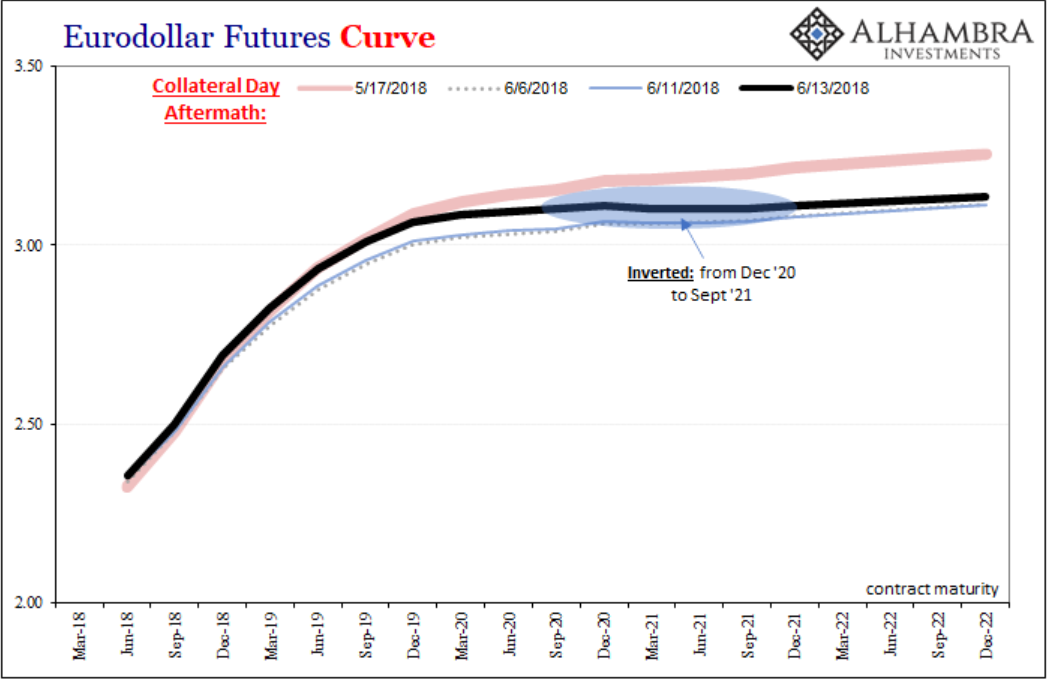
Don’t just take my word for it, you can take the Eurodollar futures curve’s word for it, because we have been here before. If we go back to the middle of 2018, the Eurodollar futures curve was painting a similar picture to today. Look below, at the 2018 Eurodollar futures curve and you can clearly see the steep front-end of the curve which was due to monetary policy because the Fed was in the middle of a rate hiking cycle. The long-end had gone completely flat, and actually inverted in a portion of it, pricing in weaker growth and inflation expectations. This was all happening while the mainstream was touting about “globally synchronized growth” and the Fed was worried about runaway inflation because the unemployment rate was at 50-year lows. Sound familiar? And in March 2020, we entered into a recession. The curves were telling us recession was inevitable, it just needed a trigger, enter Covid. I know, 2021-22 is different because of this reason and that reason. Oh, and 2018 was different because of this reason and that reason, except that it wasn’t different: growth slowed, and inflation rolled-over and the Eurodollar futures curve told us this in advance. And the Eurodollar futures curve is again telling us that weak growth and lower inflation is in on the horizon, which, again, is the opposite of what the mainstream and the Fed believes, just like 2018 (and 2014, 2011). For a more in-depth analysis of the Eurodollar futures curve, I recommend Jeff Snider’s article, This Is A Big One (no. it's not clickbait).
So, if you believe that the bond market signals are distorted because of the Fed, I hope by now you no longer believe that to be true, because the Eurodollar futures market, of which the Fed play ZERO role, is telling you the exact same thing! From flatter curves to inversion in Euodollar futures, the bond market and the Eurodollar futures market are telling us that money conditions are getting tighter, economic growth is slowing, inflation will not last, and a potential recession is on the horizon. Remember, the Eurodollar futures market are the global dealer banks, those that represent the shadow money system, those that create eurodollars (offshore dollars), and they are speaking loudly and clearly – deflationary potential is mounting. So, forget what you hear from the mainstream and the Fed, because those at the forefront of the global monetary system are telling you that they are wrong.
Author

Ryan Miller
Ryan Miller Trading Economics
Ryan Miller received a Bachelors Degree in History from William Paterson University. Through his studies of U.S. history, he developed an interest in the implications the financial markets have on the economy.