What is the yield curve and why is it important for banks?

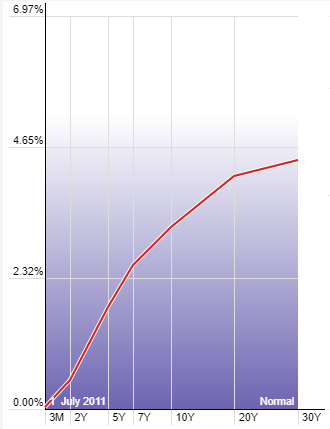
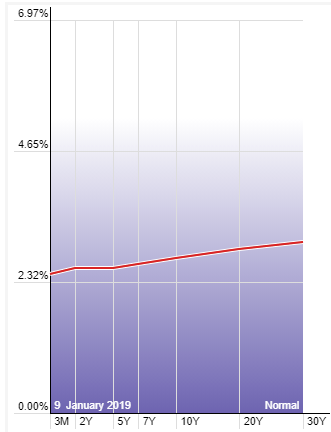
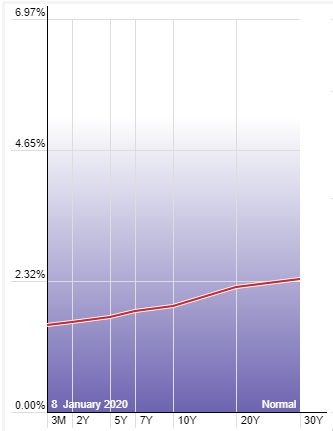
The yield curve has gained a ton of attention the past several weeks because yields on the long-end of the curve have been rising quite drastically. From a bank lending perspective, it’s not so much about the level of yields as it is about the steepness of the yield curve. For those unfamiliar, the yield curve represents the level of yields across different maturities, from overnight bonds all the way up to 30-year bonds. The level of these yields determines the shape of the curve – is it steep, flat, or inverted? To show you what I mean, take a look below. I have two charts, the first one depicting a “steep” yield curve and the second one showing a “flat” yield curve (left side shows the rate percentage and the bottom shows the bond maturity). A steep yield curve means long-term yields are much higher than short-term yields. Whereas a flat yield curve is when long-term and short-term rates are very close together. In some instances, short-term rates can even become higher than long-term rates. This is what is known as an “inverted” yield curve. When this occurs, usually the economy enters into recession, on an average of about eighteen months later. However, that topic is for another day.
The yield curve is important for two main reasons: interest rates are structured based on bond yields and because banks borrow short and they lend long – they borrow from other financial institutions at the short-end of the curve and they lend to consumers via loans, mortgages, etc. at the long-end of the curve.The difference between the short-term interest rate that banks borrow at and the long-term interest rate which they lend to consumers at is known as the “spread” and it is how banks make their money. If the yield curve is flat, then the spread (bank’s profit) is very tight, not allowing for much money to be made on lending, which deters them from lending. However, if the yield curve is steep, the spread (bank’s profit) is much wider, encouraging banks to take on more risk and lend out money.
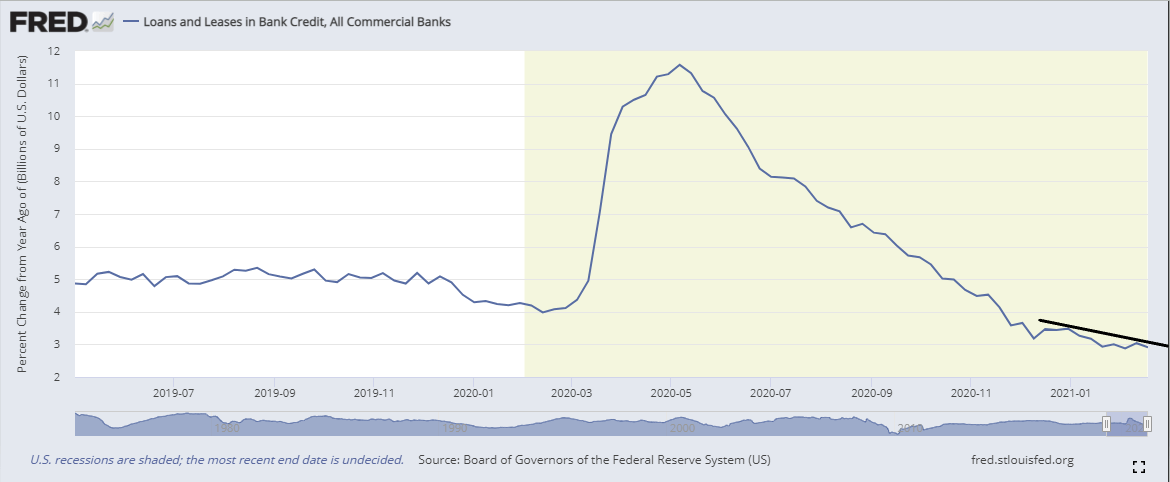
Towards the end of 2017 the yield curve started flattening out, which meant returns on bank lending started to shrink. In 2018 the yield curve completely flattened and in 2019 it inverted temporarily. The profit margin on lending has been very tight for banks for a couple of years now. If you look (below), I have a chart of loans and leases for all commercial banks. You can see that in 2018-2019 credit growth was pretty flat. Following the March 2020 selloff in risk assets there was a huge spike in credit growth because the government rolled out stimulus packages, including government guaranteed bank loans. In that short window of time credit growth didn’t really have much to do with the shape of the yield curve, but more to do with the actions of policymakers. Since then, credit has been steadily contracting and is now well below its low last seen at the beginning of 2020.
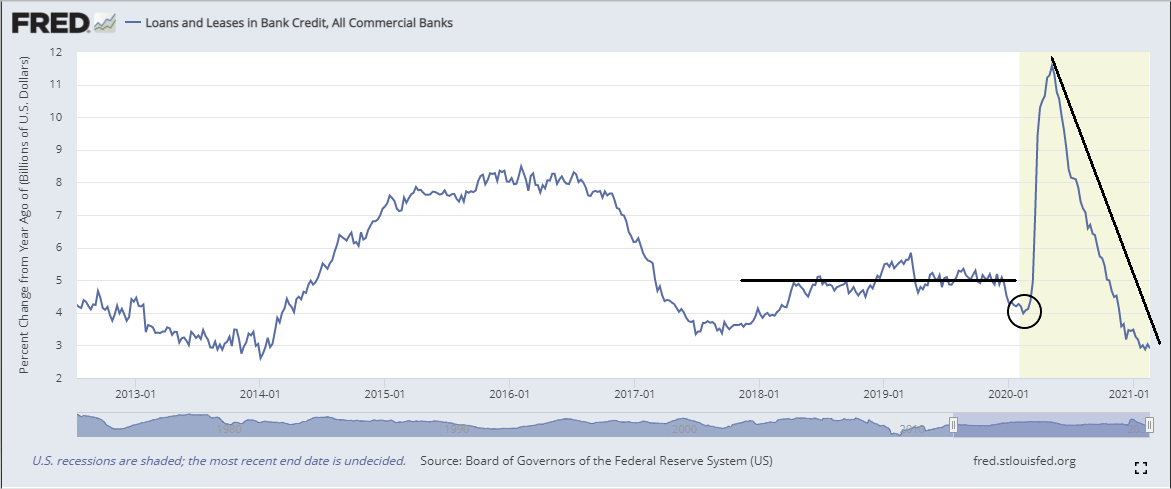
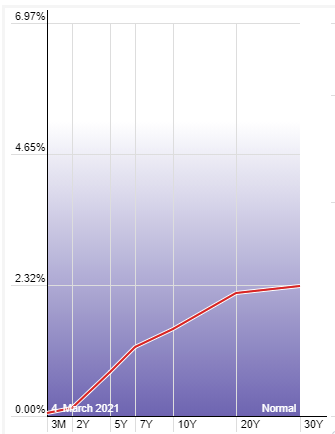
However, since the beginning of 2021, long-dated yields have been rising while the short-end has fallen further towards zero, steepening the yield curve. The yield curve is the steepest it has been since 2016 (look below at the 1st chart for the current shape of the yield curve versus its shape a year ago in the 2nd chart). As a bank, this is exactly what you want to see because it means returns on lending are increasing. Now, you would expect the steepening of the curve to encourage more lending from banks, although does not appear to be happening. If we zoom in (below, 3rd chart) on loans and leases in bank credit, you can see since January that credit has actually slightly contracted, despite the steepening of the yield curve. Unfortunately for banks, current financial conditions do not warrant much in terms of risk-taking, which is why credit has been contracting since May 2020. There’s also the other side of the equation which needs to be taken into consideration, which is borrowers. In order to see an expansion in credit, lenders need to be willing to lend and borrowers need to be willing to borrow. Until financial conditions improve, I do not see both sides willing to play ball.
The shape of the yield curve determines how much money the banks make on lending, thus determining their appetite for lending. But, economic and financial conditions must also be taken into consideration. Just because the spread widens, doesn’t mean banks automatically become looser with their lending policies. Banks act on a risk-adjusted basis. Just like a trader who searches for quality risk-to-reward opportunities in the markets, banks do the same. Even if there is money to be made via lending, if the risk is too great, banks will not lend. They would rather keep their money in safe, liquid assets – US Treasuries. This is exactly the behavior we have been seeing from banks, especially since the pandemic struck. Lending standards have tightened up, credit has contracted, and banks have piled into US Treasuries. Despite the recent steepening of the curve, expect more of the same behavior from banks until market conditions begin to improve.
Author

Ryan Miller
Ryan Miller Trading Economics
Ryan Miller received a Bachelors Degree in History from William Paterson University. Through his studies of U.S. history, he developed an interest in the implications the financial markets have on the economy.