The yield curve is screaming for attention

As inflation data remains elevated, many have been calling for the Fed to take action before they fall behind the curve (pun intended) on inflation. The Bank of Canada last week announced the end of their QE program which means the next step is for them to start raising their overnight interest rate. This is the action many believe the Fed should be taking to try and combat inflation. It is very likely that in the FOMC Statement or press conference later today, QE tapering (reducing bond purchases) will be announced. This is the first step towards monetary tightening, with potential rate hikes in 2022. The question becomes, is monetary tightening justified at this point in time? Let’s find out by analyzing the signals the yield curve has presented us with.
But first, let’s get into a few basics of the yield curve. There is the short-end of the curve which is the overnight rate out to the 2-year note (the 2-year has proven to be very effective in front-running the Fed’s overnight rate). The belly of the curve is the 3-year note through to the 7-year note (some consider the 7-y part of the long-end). Finally, the long-end is the 10-year note out to the 30-year bond. The short-end is the most heavily influenced by monetary policy. The belly is influenced by monetary policy but also starts to become sensitive to growth and inflation expectations. The long-end is the most heavily influenced by growth and inflation expectations. The Fed adjusts its monetary policy based on its outlook of the economy by taking into consideration both growth and inflation prospects. Now, since the long-end is the most sensitive to growth and inflation expectations (and the least influenced by monetary policy), it acts as a correcting mechanism of the Fed’s monetary policy – it tells us whether the Fed’s policy is justified and if the economy is headed in the same or opposing direction of what the Fed is projecting.
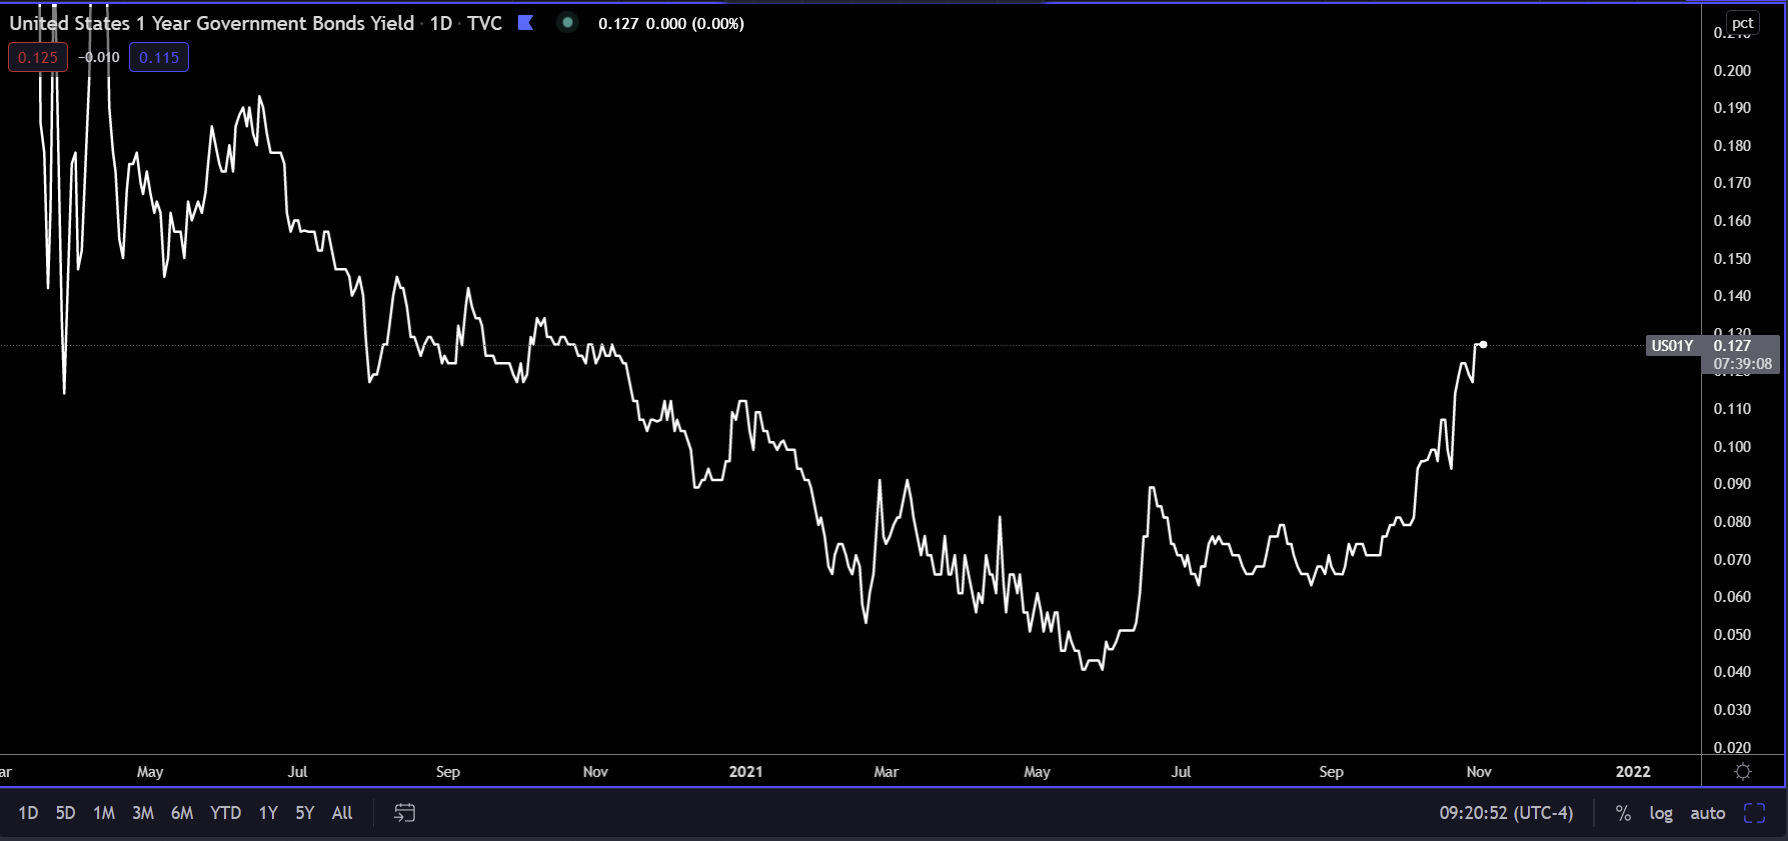
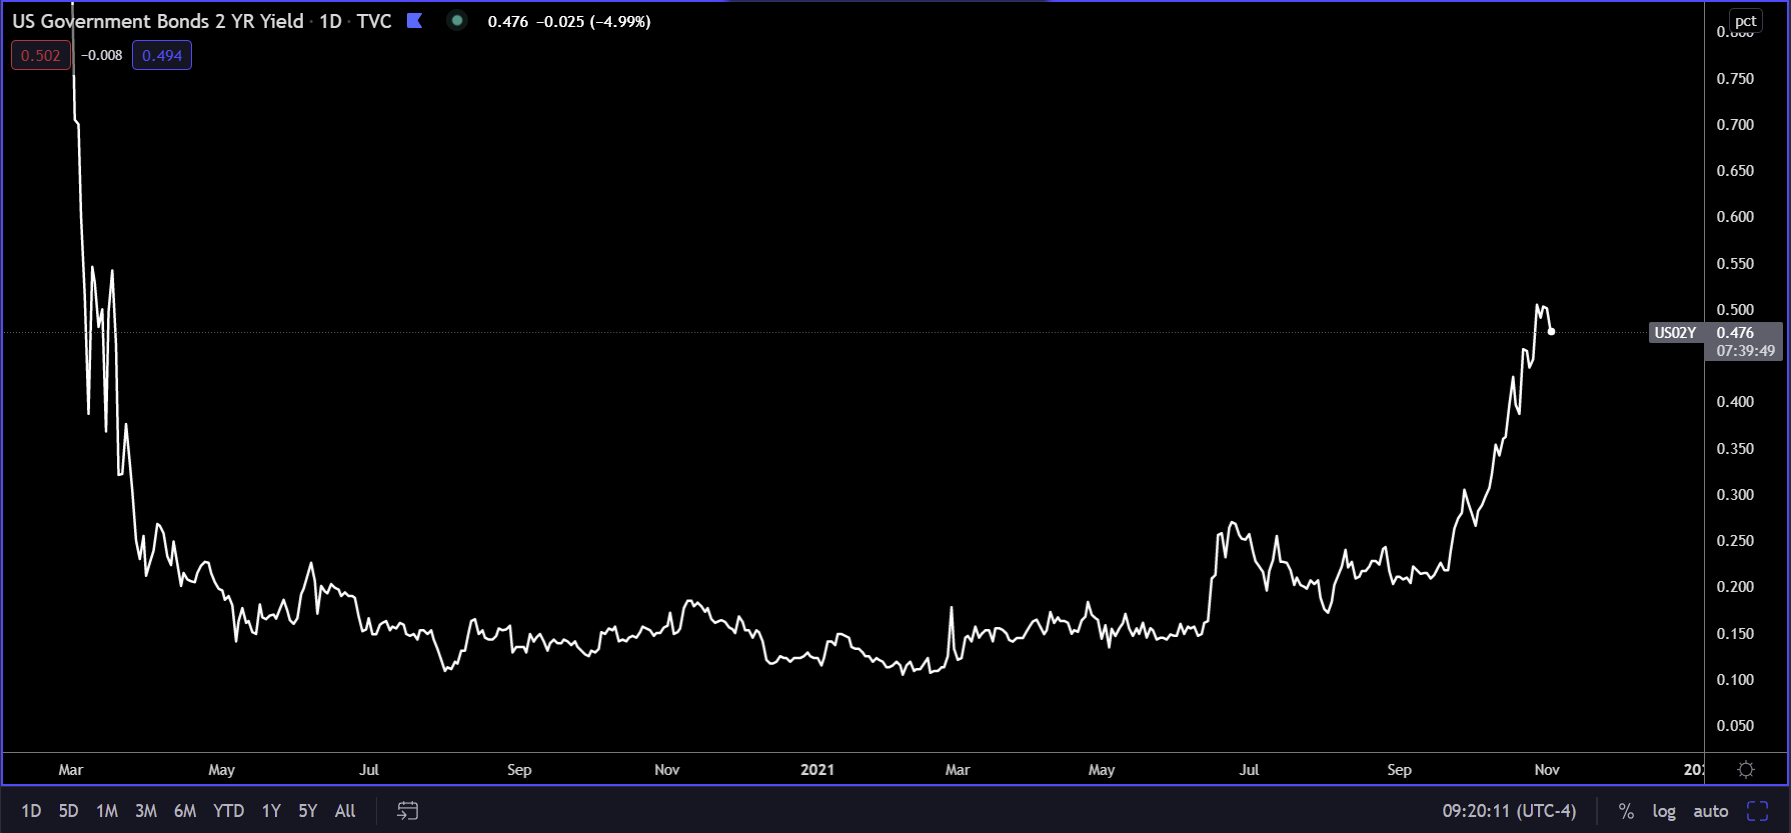
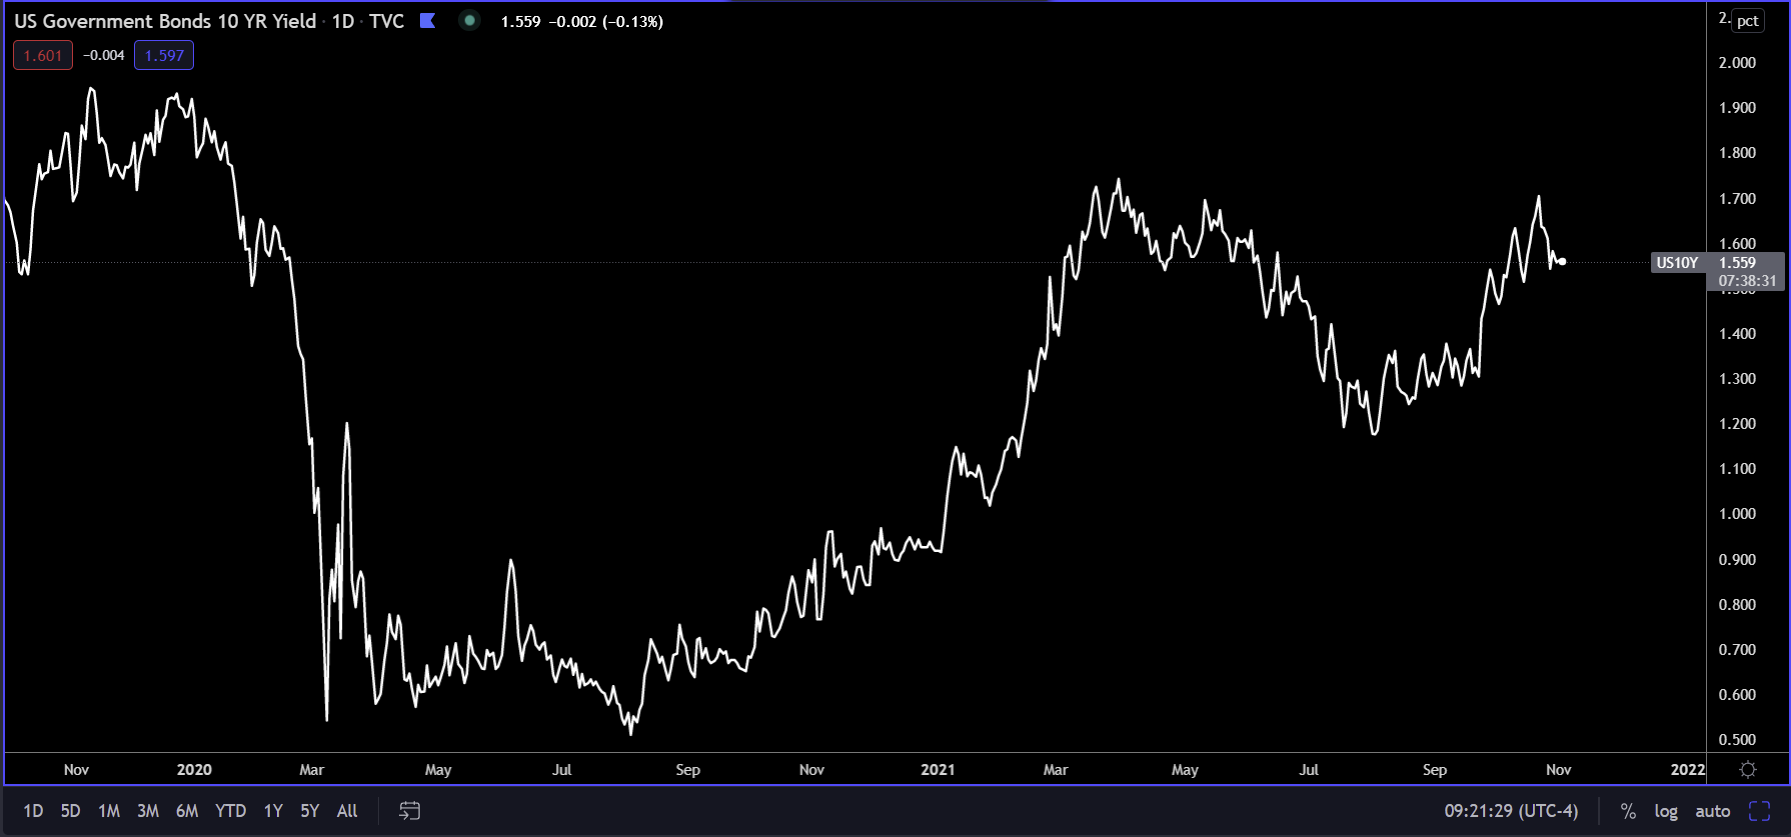
So, if the Fed announces a taper of its QE purchases at today's meeting, this is the first step towards the monetary tightening process (raising rates), which suggests the Fed believes inflation will persist and economic growth is going to re-accelerate. You can see this clearly in the short-end of the yield curve below, particularly with the 1-year and 2-year yields (first and second chart below). Currently, the 2-year is pricing in about two rate hikes in 2022. The market right now believes that the Fed will taper its QE and possibly get in a couple of rate hikes. But, are these actions warranted? If you look at the third an fourth charts below, you can see that the 10-year and 30-year yields have not moved up as much as the short-end has, suggesting that inflation at these levels will not persist and growth will continue to slow.
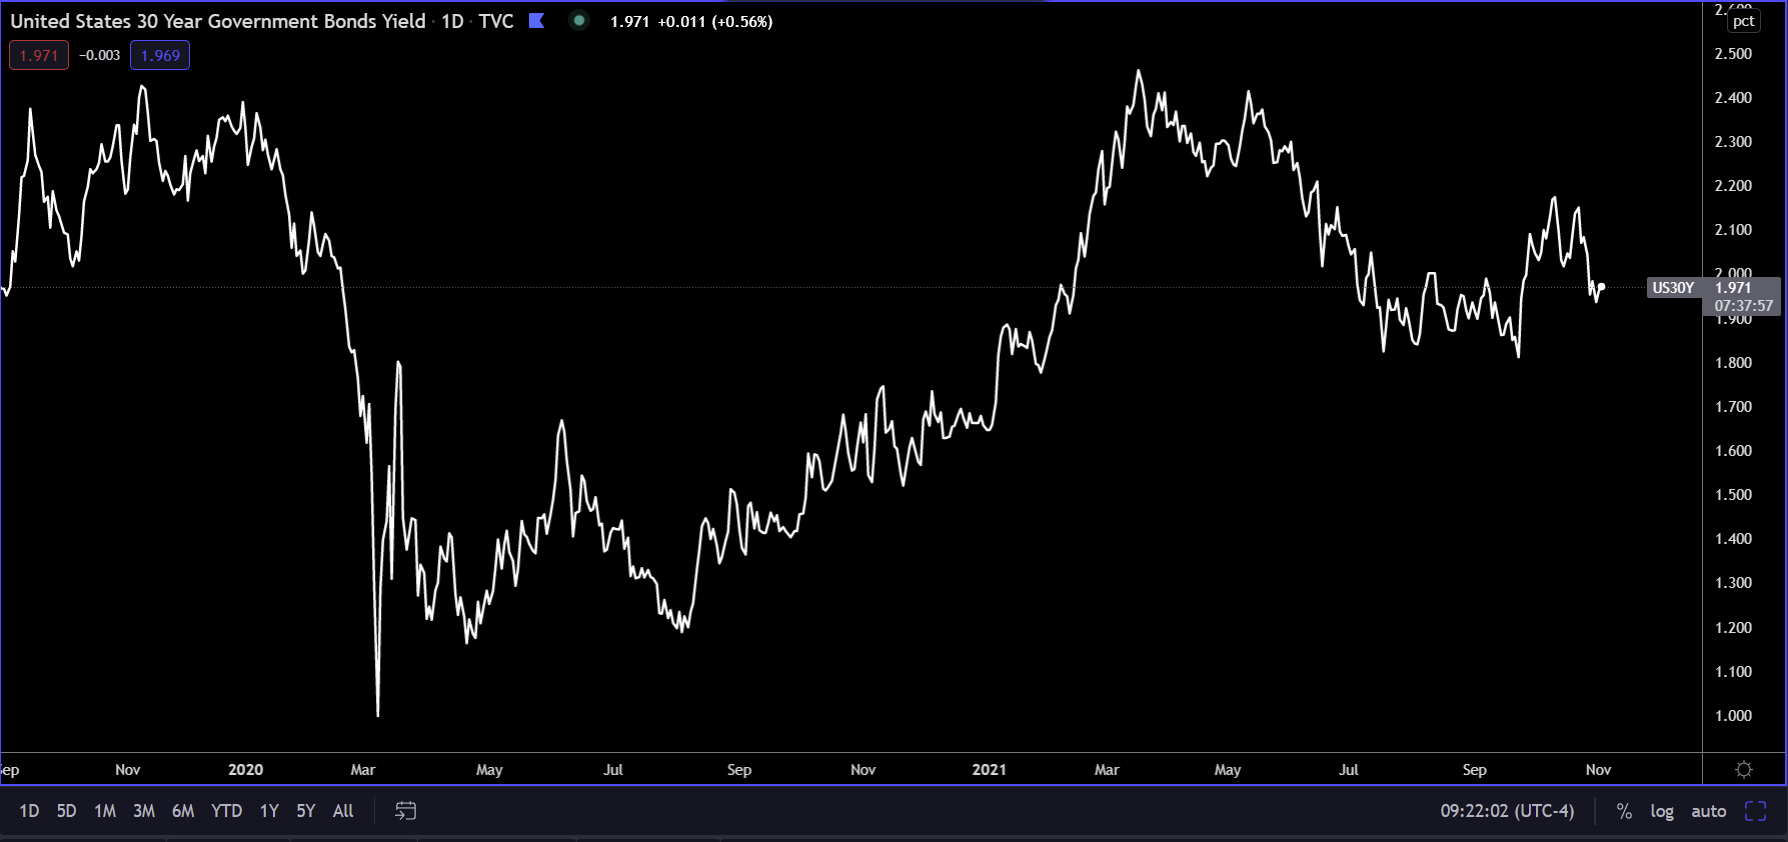
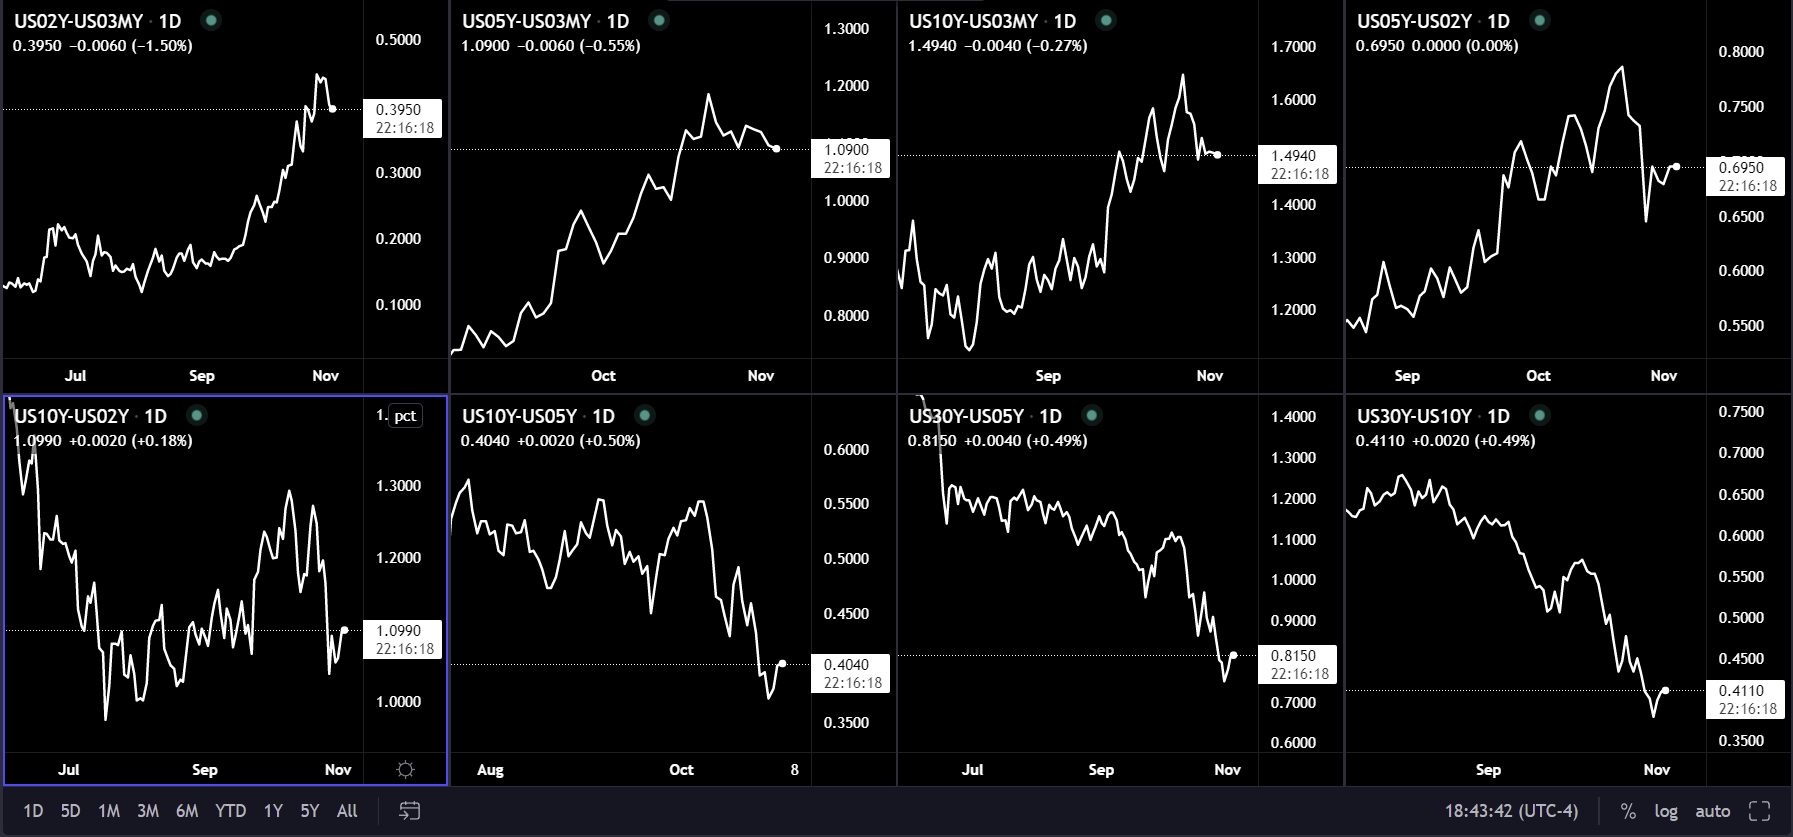
Now, let’s take a closer look by analyzing the shape of some of these curves (the spread between two different maturities). If you look below, I have a chart that depicts the spread between several different yields. A line going up indicates the yield listed first is moving up faster than the one listed second – curve steepening. And a line going down indicates the first yield is moving up slower (possibly even flat or falling) than the second yield – curve flattening. The former can be seen when inflation and growth expectations are rising and the latter when inflation and growth expectations are falling. If you look at the two charts in the top left-hand corner you can see that the 2-year yield and the 5-year yield are outpacing the 3-month yield, otherwise known as yield curve steepening. This is the market believing that the Fed will begin tightening, starting with QE and eventually moving on to rate hikes. Now, if you look at the bottom row which depicts the longer-end, all of these lines have been going down, indicating yield curve flattening. The bottom left hand corner charts shows the popular 2-y vs 10-y spread. From July through the beginning of October the line was going up, indicating steepening, because the 10-y was moving up faster than the 2-y. This is what you would expect to see when the market is pricing in better growth and inflation expectations. However, since October, the spread between the 2-y and 10-y has flattened out. If you continue to look at the bottom row, you can see that the long-end of the curve has flattened out considerably, especially the 30-year which is the most sensitive to growth and inflation expectations. If you recall the 30-year yield from the chart above, it has actually been falling, as the curve is flattening. This is known as a bull flattener and is a very strong signal for an economic growth slowdown. As supply chains eventually work themselves out, and real economic growth falls due to over indebtedness, unproductive debt financed government spending, lack of private investment, and an aging demographics, it will drag the inflation rate down with it.
So, the short-end of the curve is clearly responding to its belief that the Fed will transition their monetary policy from an accomodative policy to a tighter policy. This is why yields on the shorter-end, especially the 2-y has risen so much (since June it’s up 44 bps or about 275%). But, the further out on the curve you go, the slower the moves get, with the 30-y actually beginning to fall again. With the long-end being the most sensitive to growth and inflation expectations, the yield curve is giving us a clear signal - potential Fed tightening is not warranted because although inflation is elevated, the bond market doesn’t believe it will persist, and it doesn’t believe growth will re-accelerate (real economic growth peaked in Q2). Inflation is being driven by the supply side, NOT the demand side. Therefore, tightening policy is not the solution to fighting inflation, especially during a growth slowdown. When growth slows down, so too does demand, and tightening policy will only further curb demand, which will put even more downside pressure on growth, which again, will drag the inflation rate down with it. Now, I only analyzed the Fed and the US here, but what I just described is happening across the developed world. Tightening by central bankers will only exacerbate the downturn in the global economy back in line with the secular trends of disinflation (outright deflation in certain parts of the world like Europe and Japan) and weaker economic growth. Since the US is in better shape than the rest of the developed world, and with other central bankers appearing to want to tighten first (see BoC, ECB, RBA), expect the sharper downturns to happen elsewhere first.
Author

Ryan Miller
Ryan Miller Trading Economics
Ryan Miller received a Bachelors Degree in History from William Paterson University. Through his studies of U.S. history, he developed an interest in the implications the financial markets have on the economy.