EUR/USD: tepid recovery could extend with soft US data

EUR/USD Current price: 1.0609
View Live Chart for the EUR/USD
The dollar is mixed across the board, but generally lower, as risk aversion took over markets. Yen and gold are advancing the most, as stocks and yields are down, whilst the EUR/USD pair regained the 1.0600 level, and trades now at 1.0610. Still, the common currency remains undermined by local political woes, contained below the weekly high settled last Monday at 1.0632. After Wall Street's opening, the US will release the Michigan Consumer sentiment index for February, expected at 96.0 from previous 95.7, and new home sales January figures, also expected to improve from previous month's readings.
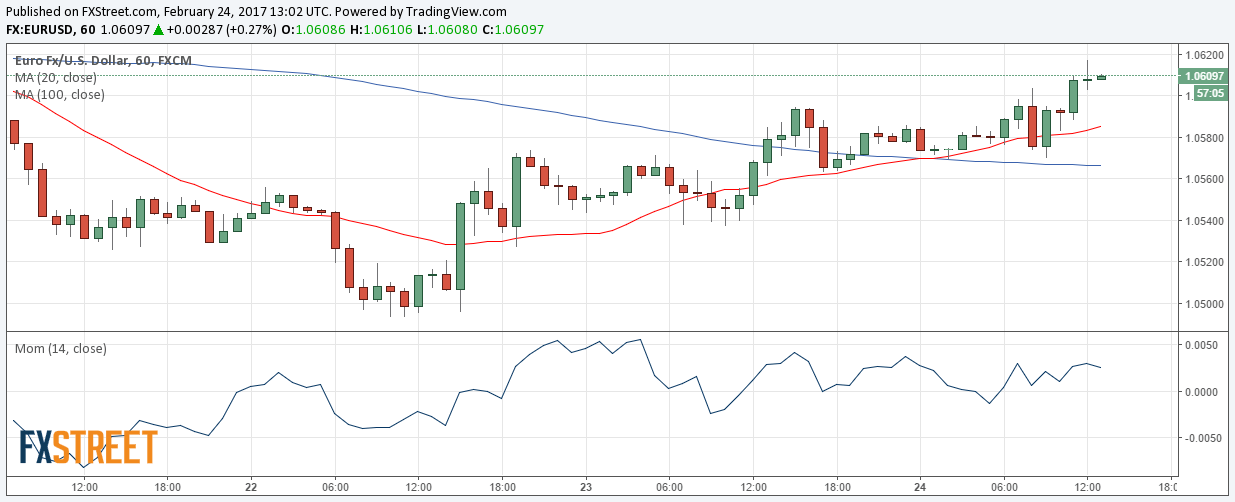
From a technical point of view, the 1 hour chart shows that the price has extended above all of its moving averages, with the 20 SMA maintaining a bullish slope. More relevant, the price is above a daily descendant trend line coming from February's high and currently around 1.0590. In the same chart, however, technical indicators have lost upward strength, turning modestly lower within positive territory. In the 4 hours chart, the 20 SMA is turning modestly higher well below the current level, whilst the Momentum indicator heads sharply higher within positive territory and the RSI indicator consolidates around 57, all of which supports additional gains on a break above the mentioned weekly high.
Support levels: 1.0590 1.0565 1.0520
Resistance levels: 1.0635 1.0660 1.0700
GBP/USD Current price: 1.2552
View Live Chart for the GBP/USD
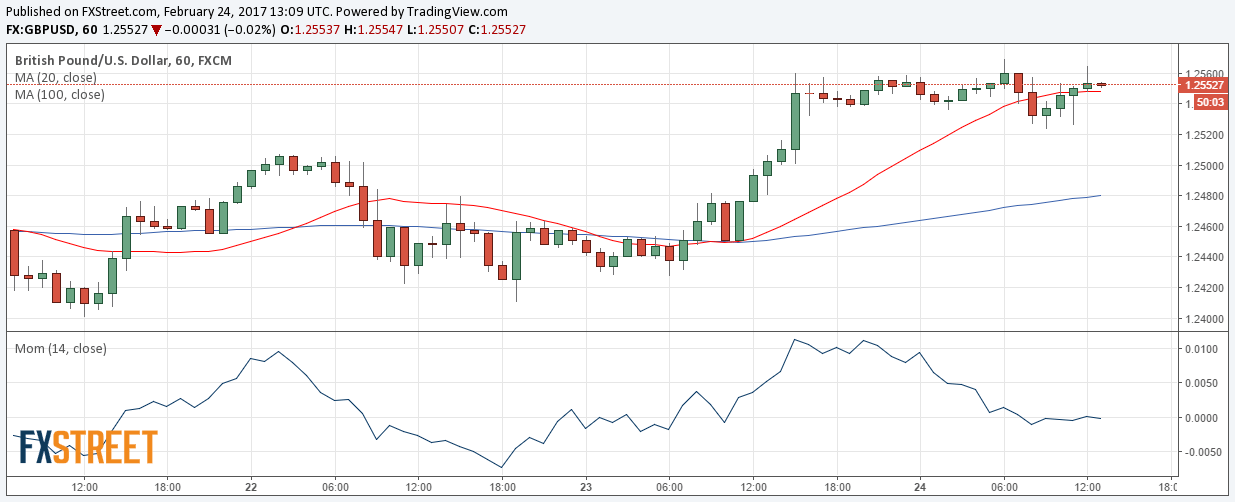
The GBP/USD pair consolidates is latest gains, holding firmly above the 1.2500 level, but contained by selling interest around 1.2560. Data coming from the UK showed that mortgage approvals rose to a 12-month high, according to the British Bankers' Association which approved 44,657 mortgages in January, up from 43,581 in December. The short term technical picture shows that a brief slide below 1.2535, the 23.6% retracement of the latest bullish rally, was quickly reversed. Still, technical indicators in the 1 hour chart have turned flat within neutral territory, whilst the price is a few pips above a flat 20 SMA, indicating limited buying interest at the time being. In the 4 hours chart, technical indicators also lack clear directional strength, but hold above their mid-lines, whilst the 20 SMA keeps advancing below the current level. At this point, the pair needs to accelerate above 1.2580, February 9th daily high to be able to extend its intraday gains towards 1.2705, this year high.
Support levels: 1.2530 1.2490 1.2450
Resistance levels: 1.2580 1.2630 1.2665
USD/JPY Current price: 112.19
View Live Chart for the USD/JPY
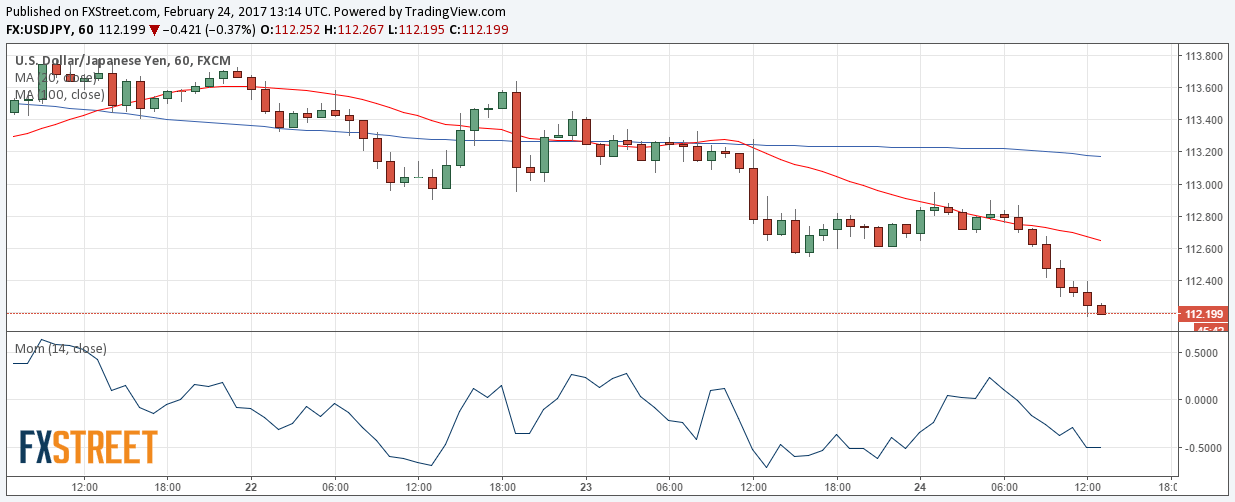
Ready to test critical 111.95 level. The USD/JPY trades at fresh 2-week lows around 112.20, as less hawkish-than-expected FED minutes, and a possible delay in the tax reform´s implementation to August, cooled demand for USD-related assets. US Treasury yields and worldwide stocks are under selling pressure, fueling yen's advance. The bearish momentum is strong in the short term, given that in the 1 hour chart, the price is developing well below its moving averages, whilst technical indicators head sharply higher within oversold territory. In the 4 hours chart, the price has accelerated lower below its moving averages, whilst technical indicators also present strong downward slopes near oversold levels. The pair may pared losses and recover partially if upcoming US data beats expectations, but it will take a clear recovery above 112.50 to revert the ongoing bearish momentum, at least in the short term.
Support levels: 111.95 111.60 111.20
Resistance levels: 112.50 112.90 113.30
AUD/USD Current price: 0.7679
View Live Chart for the AUD/USD
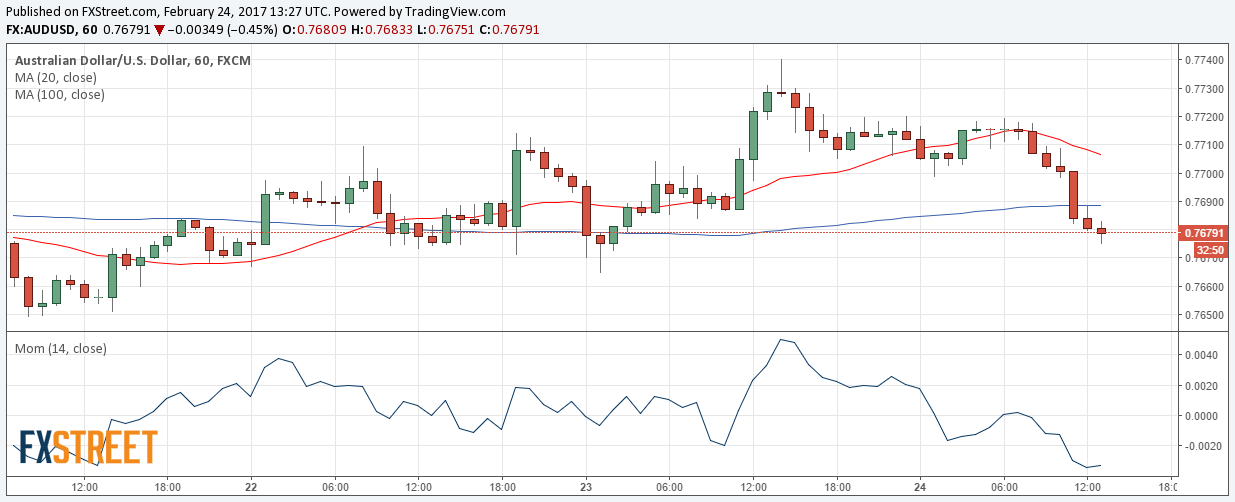
The AUD/USD pair trades lower in range, with the Aussie easing after RBA's Governor Lowe hinted that rates will remain at record-low of 1.5% for an extended period, when testifying before a parliamentary committee in Sydney. Governor Lowe remarked that he expects “a period of stability” in interest rates and suggested further cuts could push already high household debt to “dangerous” levels. From a technical point of view, the pair remains within the 0.76/0.77 range, and in the 1 hour chart, technical indicators have turned flat within oversold territory, as the pair bounced modestly from a daily low of 0.7674, but the 20 SMA maintains a strong bearish slope far above the current level. In the 4 hours chart, the price is a handful of pips below a bullish 20 SMA, whilst technical indicators have lost their bearish strength after entering negative territory, indicating a limited bearish potential at this point.
Support levels: 0.7660 0.7610 0.7575
Resistance levels: 0.7710 0.7735 0.7770
Author

Valeria Bednarik
FXStreet
Valeria Bednarik was born and lives in Buenos Aires, Argentina. Her passion for math and numbers pushed her into studying economics in her younger years.


