Microsoft Inc.(MSFT) Elliott Wave technical analysis [Video]
![Microsoft Inc.(MSFT) Elliott Wave technical analysis [Video]](https://editorial.fxstreet.com/images/Markets/Equities/Ibex/madrid-stock-exchange-spain-eu-16703960.jpg)
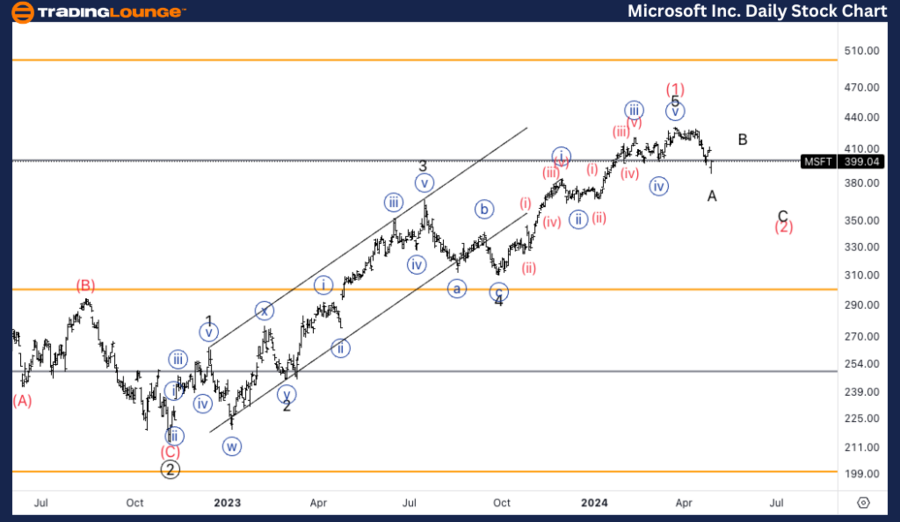
MSFT Elliott Wave technical analysis
Function: Counter Trend.
Mode: Corrective.
Structure: Zigzag.
Position: Intermediate (2).
Direction: Bottom in wave A of (2).
Details: We are considering a significant top in place with wave (1), and we are now looking for a three wave move correction into wave (2). We seem to be finding buyers on Medium Levell 400$, looking for 400$ to turn into resistance.
MSFT Elliott Wave technical analysis – Daily chart
The daily chart of MSFT shows the stock in a corrective phase with a zigzag structure, identified as Intermediate wave (2). Currently, the stock is witnessing a bottom formation in wave A of (2). After observing a significant top in wave (1), MSFT appears to be undergoing a corrective three-wave movement. The price level around $400, which has been attracting buyers, is anticipated to evolve into a resistance level. Traders should monitor this zone closely for potential reversal signals.
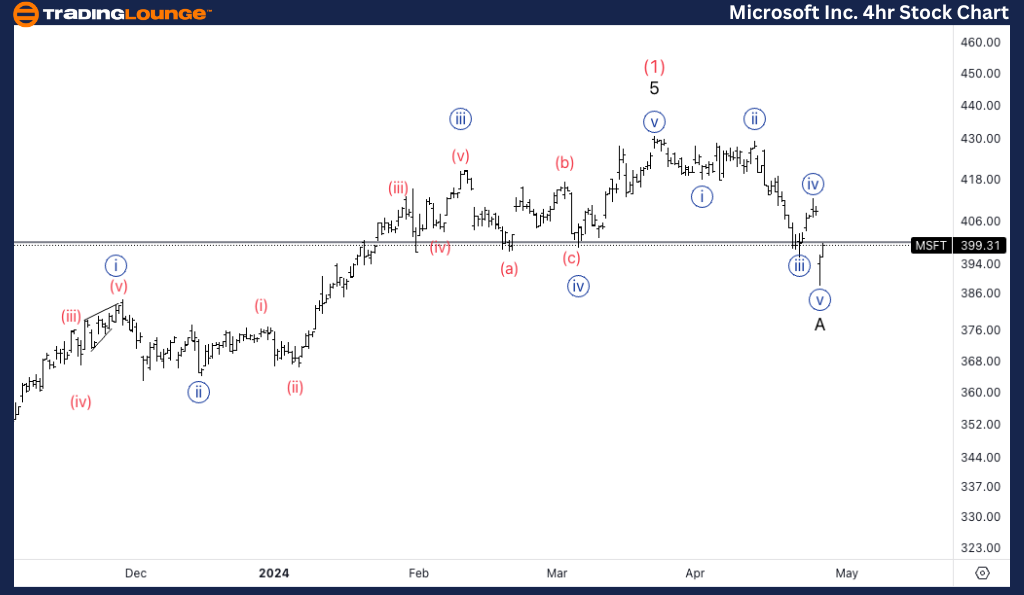
Function: Counter Trend.
Mode: Corrective.
Structure: Zigzag.
Position: Wave A.
Direction: Bottom in wave {v}.
Details: I can count a clear five wave move into wave A, with alternation between {ii} and {iv}. Looking for a pullback in wave B to then fall back lower.
MSFT Elliott Wave technical analysis – Four-hour chart
Moving into the 4-hour chart, the analysis continues to reflect a counter-trend with a zigzag corrective structure, highlighting the end of Wave A. Here, a clear five-wave movement has been identified, with distinct alternations between waves {ii} and {iv}. The current position, at the bottom of wave {v}, suggests that the stock might experience a short-term pullback in wave B before potentially declining further. This provides a strategic point for traders to look for entry and exit points during the unfolding of wave B.
MSFT Elliott Wave technical analysis [Video]
Author

Elliott Wave Forecast Team
ElliottWave-Forecast.com


