EUR/USD Forecast: Rebounds could see 1.0950 retested
- EUR/USD partially left behind recent bearishness.
- The Dollar navigated a narrow range amidst firm yields.
- Investors will look at US politics and key data this week.

The US Dollar (USD) retreated marginally on Monday, leaving the USD Index (DXY) around 104.30, despite a solid rebound in US yields across various time frames.
In response, EUR/USD halted its two-day pullback and revisited the 1.0900 barrier, although the move seems to have lacked conviction and fizzled out afterwards amidst the broad-based absence of volatility in the FX space.
Meanwhile, yields in the US and Germany edged higher following the change of landscape in the US political scenario, while ECB board member P. Kazimir advocated two more rate cuts for the remainder of the year if data supported those decisions.
Around the Fed, an interest rate cut in September appears fully priced in, while investors see another rate reduction in December.
Meanwhile, the Eurozone's economic recovery prospects and signs of cooling in key US economic indicators may reduce the ongoing disparity in monetary policy between the Fed and the ECB, occasionally supporting the EUR/USD pair in the near future. This perspective has gained traction alongside rising expectations of Fed interest rate cuts.
Looking ahead, key US GDP figures, advanced PMIs across the FX world, and US PCE data should dictate the markets’ sentiment in the next few days.
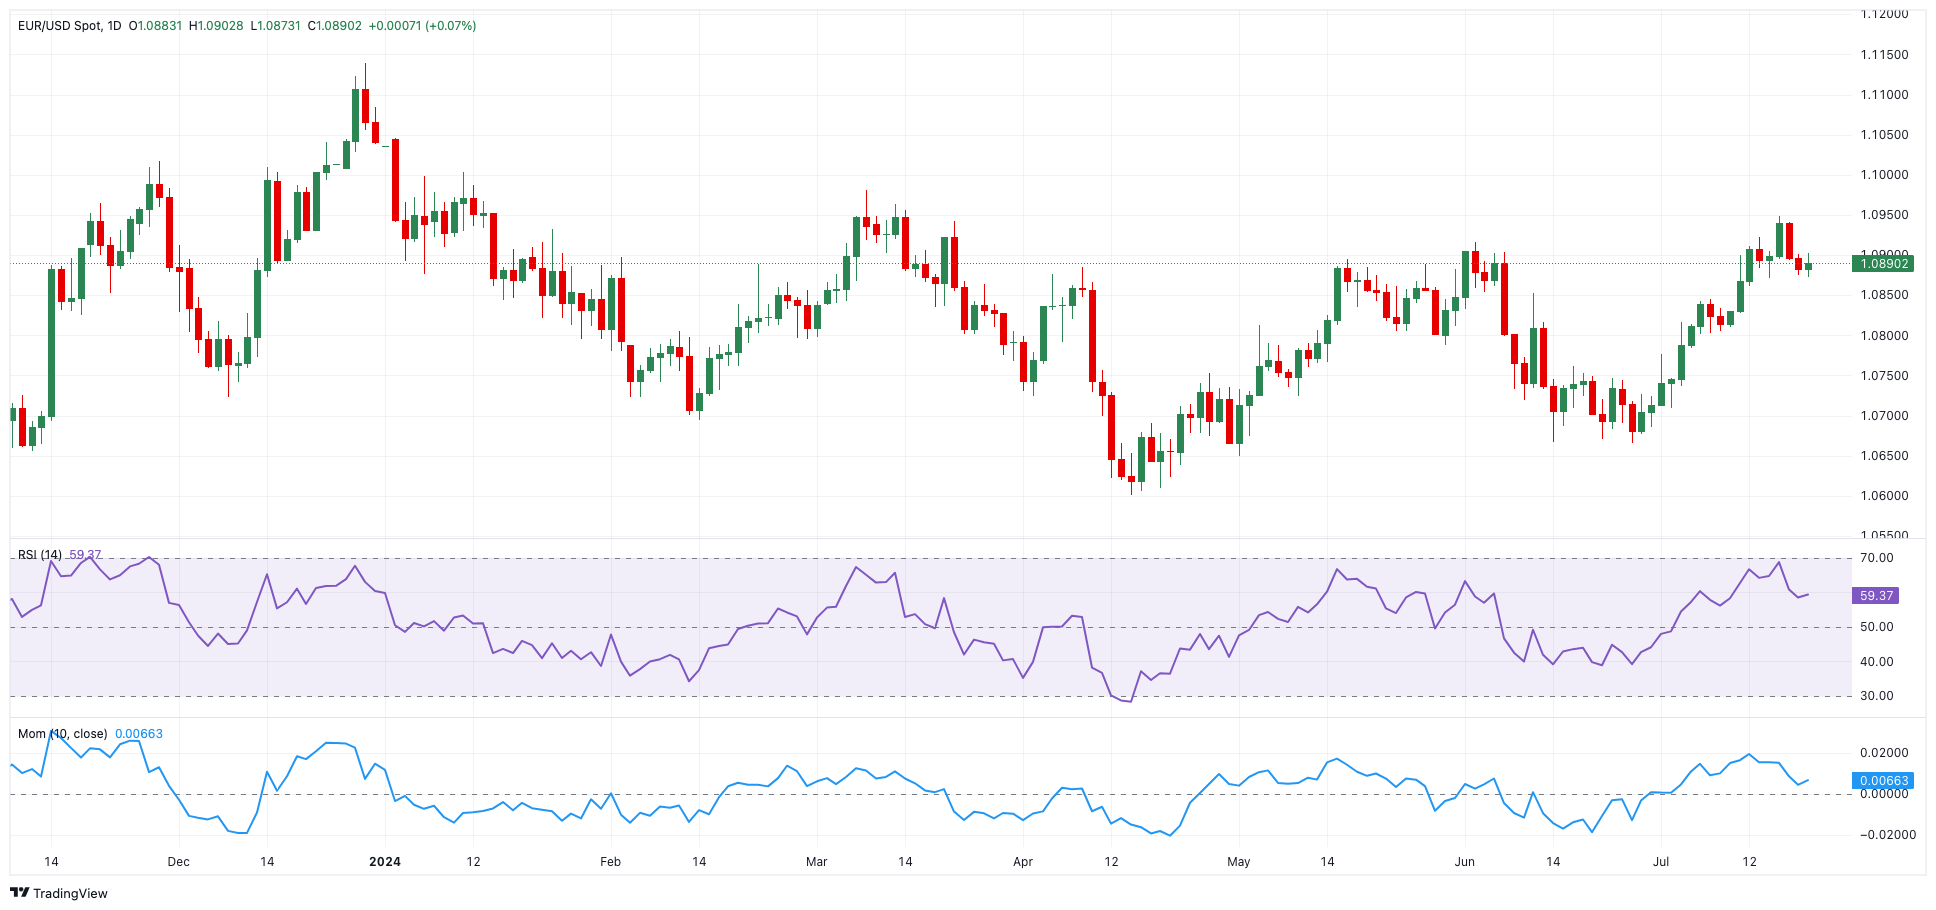
EUR/USD daily chart
EUR/USD short-term technical outlook
EUR/USD is projected to confront more upward resistance at the July peak of 1.0948 (July 17), followed by the March high of 1.0981 (March 8) and the key 1.1000 level.
If bears reclaim control, the pair may approach the 200-day SMA of 1.0813 before falling to the June low of 1.0666 (June 26). The loss of the May low of 1.0649 (May 1) leads to the 2024 bottom of 1.0601 (April 16).
Looking at the big picture, it appears that more gains are on the way if the par keeps the trade above the key 200-day SMA.
So far, the 4-hour chart indicates some temporary consolidation. However, the initial resistance is 1.0948, which comes before 1.0981 and 1.1000. On the other side, the 100-SMA at 1.0838 is first, followed by the 200-SMA at 1.0793 and then 1.0709. The relative strength index (RSI) improved to about 48.
Author

Pablo Piovano
FXStreet
Born and bred in Argentina, Pablo has been carrying on with his passion for FX markets and trading since his first college years.

















