Downslide continues

USD: Jun '25 is Down at 102.875.
Energies: May '25 Crude is Up at 60.77.
Financials: The Jun '25 30 Year T-Bond is Lower by 13 ticks and trading at 117.03.
Indices: The Jun '25 S&P 500 emini ES contract is 314 ticks Higher and trading at 5177.00
Gold: The Jun'25 Gold contract is trading Up at 3023.80
Initial conclusion
This is a nearly correlated market. The USD is Down and Crude is Up which is normal, and the 30 Year T-Bond is trading Lower. The Financials should always correlate with the US dollar such that if the dollar is Higher, then the bonds should follow and vice-versa. The S&P is Higher and Crude is trading Higher which is not correlated. Gold is trading Higher which is correlated with the US dollar trading Down. I tend to believe that Gold has an inverse relationship with the US Dollar as when the US Dollar is down, Gold tends to rise in value and vice-versa. Think of it as a seesaw, when one is up the other should be down. I point this out to you to make you aware that when we don't have a correlated market, it means something is wrong. As traders you need to be aware of this and proceed with your eyes wide open. All of Asia traded Lower. All of Europe is trading Lower as well.
Possible challenges to traders
-
NFIB Small Business Index is out at 6 AM EST. This is Major.
-
FOMC Member Daly Speaks at 2 PM EST. This is Major.
Traders, please note that we've changed the Bond instrument from the 10 Year (ZN) to the 2 Year (ZT). They work exactly the same.
We've elected to switch gears a bit and show correlation between the 2-year Treasury notes (ZT) and the S&P futures contract. The YM contract is the Dow Jones Industrial Average, and the purpose is to show reverse correlation between the two instruments. Remember it's likened to a seesaw, when up goes up the other should go down and vice versa.
Yesterday the ZT dived Lower at around 8:15 AM EST with no economic news is sight. The Dow moved Higher at the same time. Look at the charts below and you'll see a pattern for both assets. The Dow moved Higher at 8:15 AM EST and the ZT moved Lower at around the same time. These charts represent the newest version of Bar Charts, and I've changed the timeframe to a 15-minute chart to display better. This represented a Short opportunity on the 2-year note, as a trader you could have netted about 30 plus ticks per contract on this trade. Each tick is worth $6.25. Please note: the front month for ZT is now Jun '25 and the Dow is Jun '25 as well. I've changed the format to filled Candlesticks (not hollow) such that it may be more apparent and visible.
Charts courtesy of BarCharts
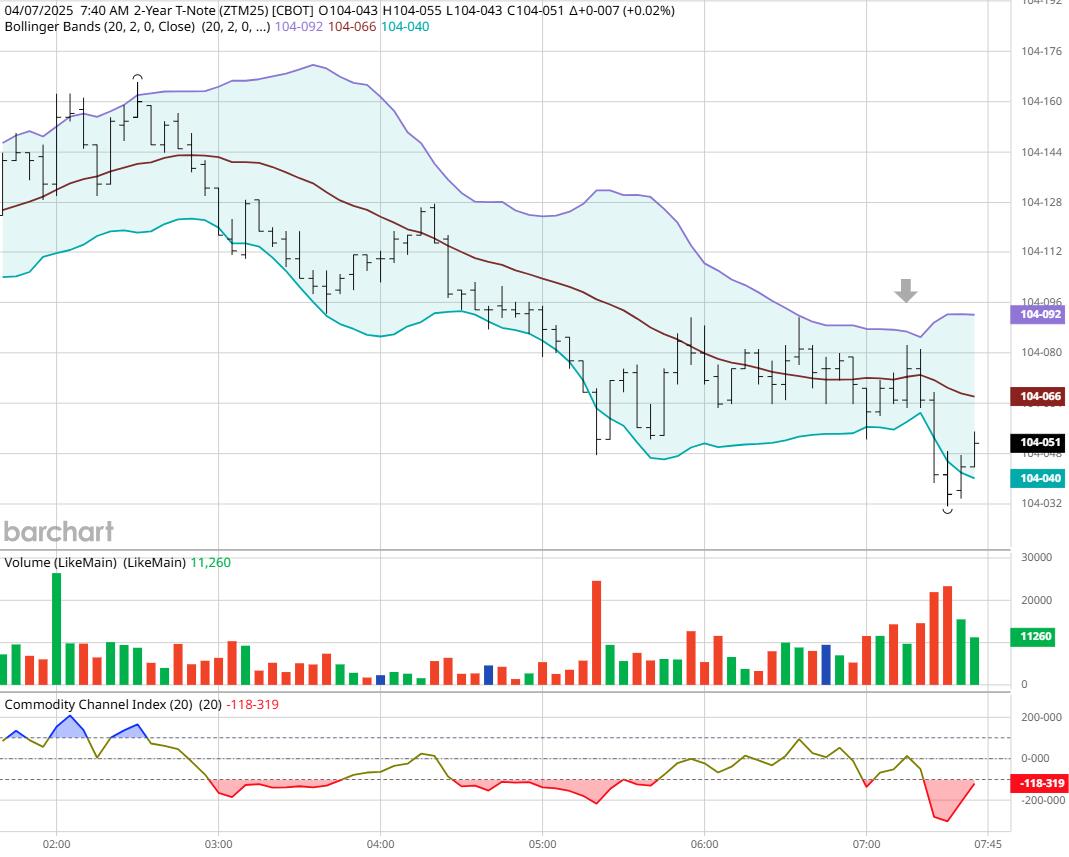
ZT -Jun 2025 - 4/07/25
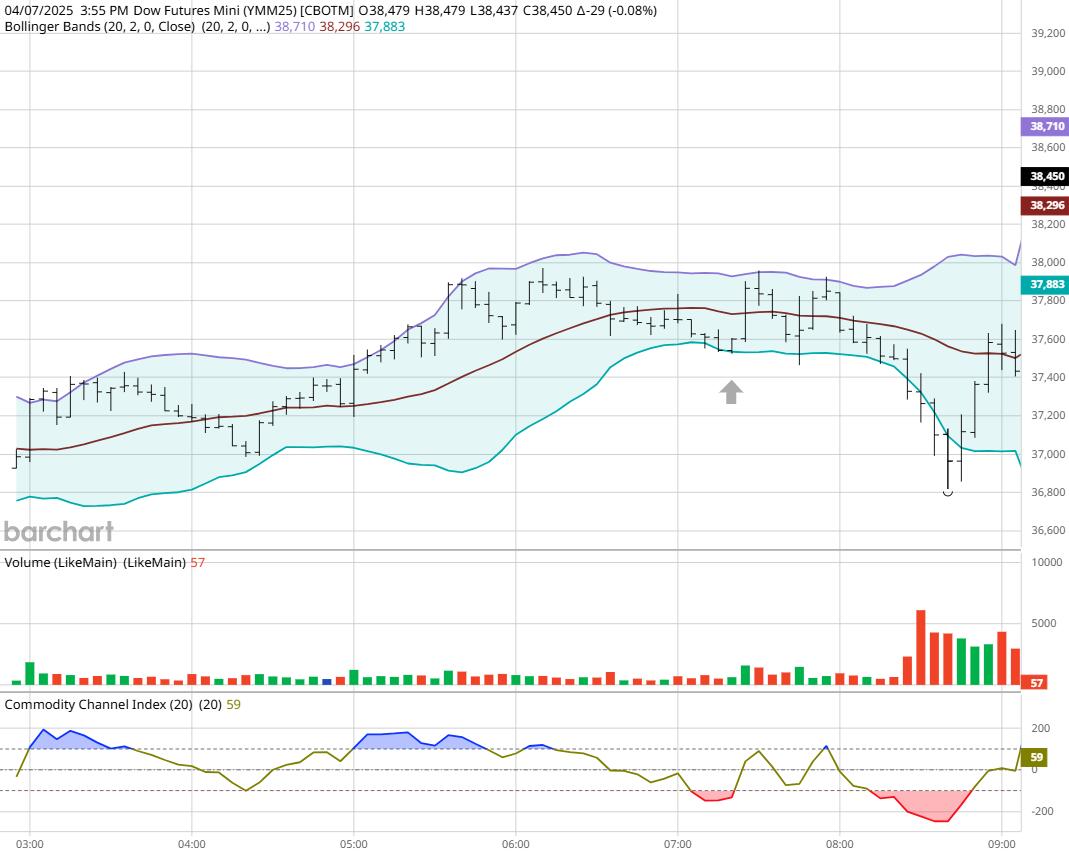
ZT -Jun 2025 - 4/07/25
Bias
Yesterday we gave the markets a Downside bias as all global indices were down. The markets didn't disappoint as the Dow closed Lower by 560 points. The other indices closed Lower as well. Today we are dealing with a nearly correlated market, and our bias is to the Upside.
Could this change? Of Course. Remember anything can happen in a volatile market.
Commentary
If anyone was expecting a market rebound yesterday, sorry to say the markets continued its downward trend. All because El Presidente wants to tariff the world. When will this end? No one knows but I suspect it will end on a country-by-country basis. As soon as the other country drops their tariff rate then the US will do the same but now, we understand that China will be tariffed even more. So, time will tell how it all works out. Want to learn Market Correlation and determine market direction hours before the Opening Bell?
Author

Nick Mastrandrea
Market Tea Leaves


