EUR/USD Forecast: Cautious buying prevails, resistance at 1.0970

EUR/USD Current price: 1.0938
- Financial markets keep rotating around central banks and monetary policies.
- The Eurozone reported a sharp decline in Industrial Production in January.
- EUR/USD is poised to resume its advance but still needs to clear a critical Fibonacci level.
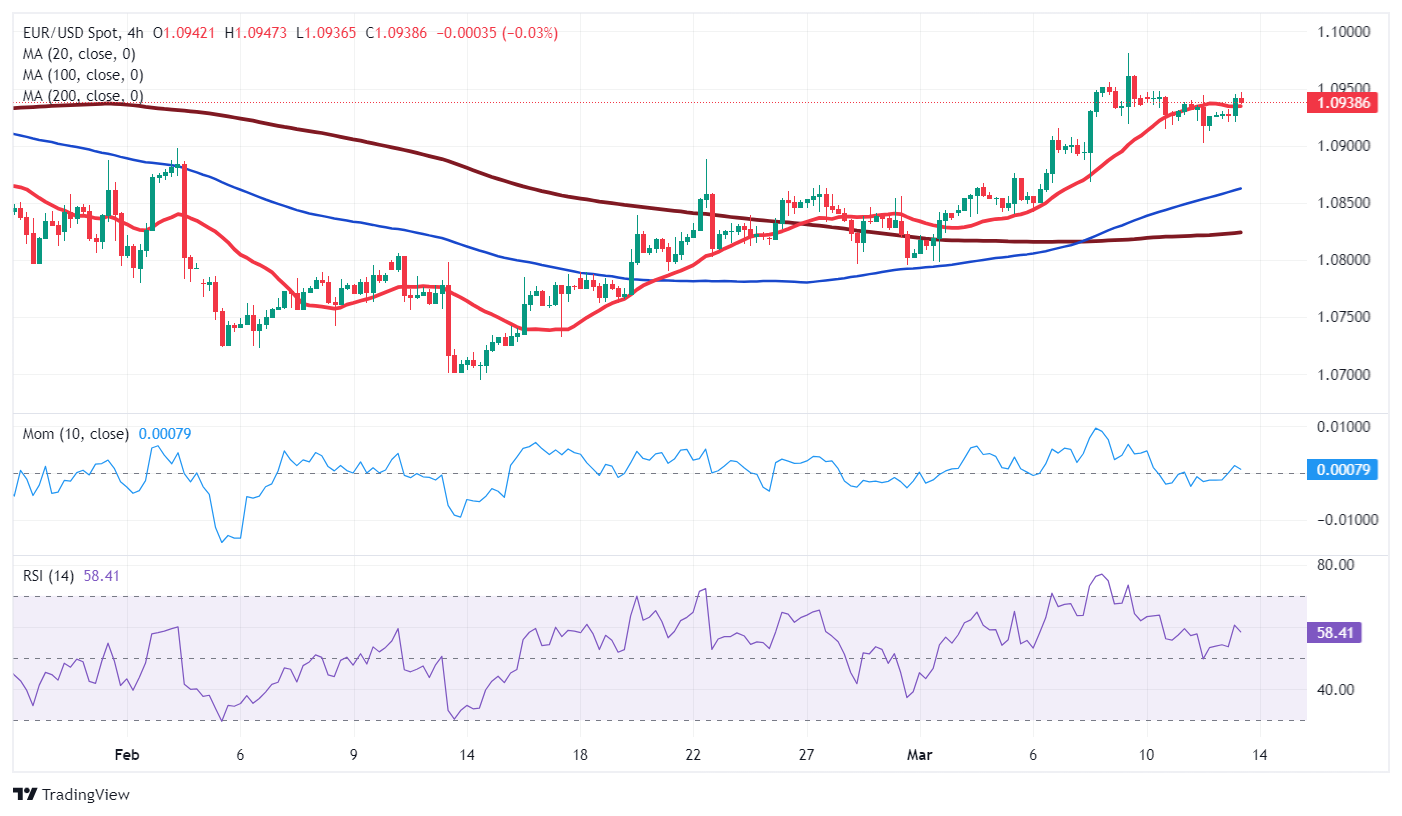
The EUR/USD pair keeps trading within familiar levels on Wednesday, hovering around 1.0940 ahead of the American session opening. Financial markets moved past the latest United States (US) Consumer Price Index (CPI). Inflation in the US remained above the Federal Reserve (Fed)’s 2% goal in February, as reported by the Bureau of Labor Statistics (BLS), and eased at a slower-than-anticipated pace. Nevertheless, the figures had no relevant impact across the FX board, and they barely moved bets on when the Fed would cut interest rates.
Wall Street closed Tuesday with solid gains after flirting with record highs, also helped by a recovering tech sector. Stocks momentum faded in Asia amid woes in China, as Country Garden Holdings, a property development company, missed a coupon payment on a yuan bond. Additionally, hopes that the Bank of Japan (BoJ) will soon end its negative-rate cycle undermining local markets.
European players seem a bit more optimistic, as most local indexes trade in the green, supporting EUR/USD. Still, Euro gains remained limited due to comments from European Central Bank (ECB) policymaker Francois Villeroy de Galhau, who said interest rate cuts are more likely in June.
Data-wise, the Eurozone published January Industrial Production, which fell 3.2% MoM and 6.7% YoY, much worse than anticipated. The upcoming US session has nothing to offer regarding data, with the focus shifting to Retail Sales figures to be out on Thursday.
EUR/USD short-term technical outlook
From a technical point of view, the risk skews to the upside. The daily chart shows the pair bounced from an intraday low of 1.0920, just above the 50% Fibonacci retracement of the 1.1139/1.0734 daily slide at 1.0917. The same chart shows that technical indicators are picking up within positive levels, reflecting that buyers hold the grip. Finally, the 20 Simple Moving Average (SMA) is crossing above the longer ones, although all of them remain confined to a tight 20 pips range.
In the near term, and according to the 4-hour chart, buyers also retain control. Technical indicators advance, although the Momentum indicator remains within neutral levels. At the same time, the pair hovers around a flat 20 SMA, still unable to gain bullish traction beyond it. The longer moving averages, in the meantime, remain well below the current level, also supporting another run higher. The main resistance level is the 61.8% retracement of the aforementioned slump at 1.0970.
Support levels: 1.0915 1.0865 1.0820
Resistance levels: 1.0970 1.1010 1.1045
Author

Valeria Bednarik
FXStreet
Valeria Bednarik was born and lives in Buenos Aires, Argentina. Her passion for math and numbers pushed her into studying economics in her younger years.

















