EUR/USD Forecast: Bulls hesitate on encouraging United States data

EUR/USD Current price: 1.0848
- The United States Q2 Gross Domestic Product resulted better than anticipated.
- Financial markets trapped between dismal earning reports and upbeat American data.
- EUR/USD keeps battling for direction around 1.0850, sentiment leads the way.
The EUR/USD pair held within familiar levels throughout the first half of the day, with the Euro showing resilience to the broad US Dollar’s strength ahead of the release of the United States (US) preliminary estimate of the Q2 Gross Domestic Product (GDP). The poor performance of global equities, led by the tech sector and dismal earning reports, underpinned the USD.
The USD maintained its positive momentum after releasing mostly upbeat US data. The economy grew at an annualized pace of 2.8%, according to the flash Q2 GDP, while inflation in the same period was lower than previously estimated. The core Personal Consumption Expenditures Price Index rose 2.9% QoQ, easing from the 3.7% posted in the first quarter, yet above expectations of 2.7%. Furthermore, the GDP Price Index rose 2.3% in the same period, below the market expectation of 2.6%.
Less relevant, the US reported that Initial Jobless Claims for the week ended July 19 hit 235K, better than anticipated, while Durable Goods Orders in June plummeted by 6.6%.
The overall encouraging news initially backed the USD, yet at the same time, helped stock markets trimm part of their early losses, somehow limiting demand for the Greenback.
EUR/USD short-term technical outlook
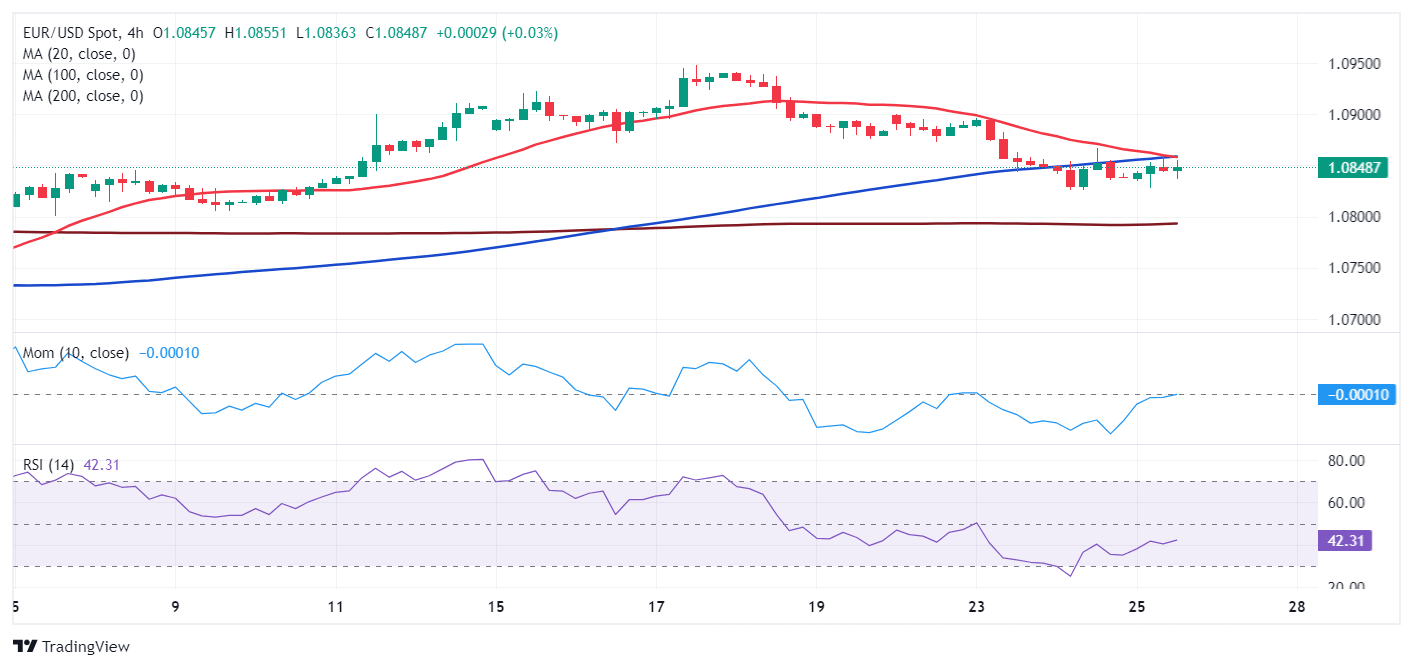
The EUR/USD pair posts modest intraday gains, battling to extend gains beyond the 1.0850 region. In the daily chart, the pair is stuck around a bullish 20 Simple Moving Average (SMA), while the longer moving averages remain directionless, just below the 1.0800 mark. Finally, technical indicators have lost their bearish slopes right above their midlines, indicating receding selling interest.
In the near term, and according to the 4-hour chart, the bullish potential remains limited. A bearish 20 SMA converges with a mildly bullish 100 SMA, converging at 1.0860. Technical indicators, in the meantime, remain within negative levels with uneven strength. Bulls may give up if the pair falls below 1.0820, an unlikely scenario at the time being.
Support levels: 1.0820 1.0770 1.0725
Resistance levels: 1.0870 1.0910 1.0945
Premium
You have reached your limit of 3 free articles for this month.
Start your subscription and get access to all our original articles.
Author

Valeria Bednarik
FXStreet
Valeria Bednarik was born and lives in Buenos Aires, Argentina. Her passion for math and numbers pushed her into studying economics in her younger years.


