Dovish to hawkish Fed: Sounds bearish for gold
With a more hawkish Fed disposition, non-commercial traders remaining dollar-strong, and the EUR/USD sinking, it doesn’t bode well for the metals.
With U.S. Treasury yields continuing their ascent on Sep. 28, the mini taper tantrum pushed the NASDAQ 100 over a cliff. And with the USD Index loving the surge in volatility, the greenback further cemented its breakout above the neckline of its inverse (bullish) head & shoulders pattern. And looking ahead, the momentum should continue. Case in point: Fed Chairman Jerome Powell testified before the U.S. Senate Banking Committee on Sep. 28. In his prepared remarks, he said:
“Inflation is elevated and will likely remain so in coming months before moderating. As the economy continues to reopen and spending rebounds, we are seeing upward pressure on prices, particularly due to supply bottlenecks in some sectors. These effects have been larger and longer lasting than anticipated, but they will abate, and as they do, inflation is expected to drop back toward our longer-run 2 percent goal.”
Furthermore, while I’ve been warning for months that Powell remains materially behind the inflation curve, his prepared remarks didn’t have a single mention of “base effects” or “transitory.” Instead, the Fed chief’s new favorite buzz word is “moderating.”
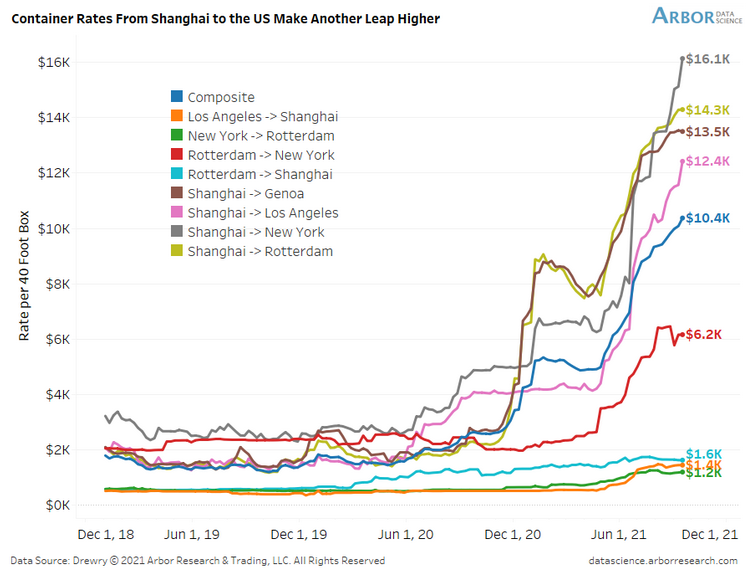
In any event, while I warned on several occasions that the composite container rate has gone from $6.5K to $8.1K to $8.4K to 9.4K, Powell finally admitted that the supply chain disruptions have “gotten worse:”
“Look at the car companies, look at the ships with the anchors down outside of Los Angeles,” he said. “This is really a mismatch between demand and supply, we need those supply blockages to alleviate, to abate, before inflation can come down.”
For context, the composite container rate is now at $10.4K (the blue line below):
To that point, with inflation surging and the Fed materially behind the eight ball, even the doves have turned hawkish since Powell unveiled his accelerated taper timeline on Sep. 22.
New York Fed President John Williams told the Economic Club of New York on Sep. 27: “I think it’s clear that we have made substantial further progress on achieving our inflation goal. There has also been very good progress toward maximum employment. Assuming the economy continues to improve as I anticipate, a moderation in the pace of asset purchases may soon be warranted.”
Likewise, Fed Governor Lael Brainard added that labor-market conditions may “soon” warrant a reduction in the Fed’s bond-buying program:
“The forward guidance on maximum employment and average inflation sets a much higher bar for the liftoff of the policy rate than for slowing the pace of asset purchases,” Brainard told the National Association for Business Economics on Sep. 27. “I would emphasize that no signal about the timing of liftoff should be taken from any decision to announce a slowing of asset purchases.”
For context, she tried to calm investors’ nerves by separating rate hikes from tapering. However, with “a much higher bar” for “liftoff” implying a much lower bar for tapering, QE is likely on its deathbed.
Rounding out the hawkish rhetoric, Chicago Fed President Charles Evans also told the National Association for Business Economics on Sep. 27 that “I see the economy as being close to meeting the 'substantial further progress' standard we laid out last December. If the flow of employment improvements continues, it seems likely that those conditions will be met soon and tapering can commence.”
And why are these three voices so important?
Well, with Powell ramping up the hawkish rhetoric on Sep. 22 and his dovish minions following suit, their messaging is much different than the hawk talk that we normally hear from Bullard, Kaplan and Rosengren. For context, the latter two actually resigned for ethical reasons after their questionable day trading activity became public.
Please see below:
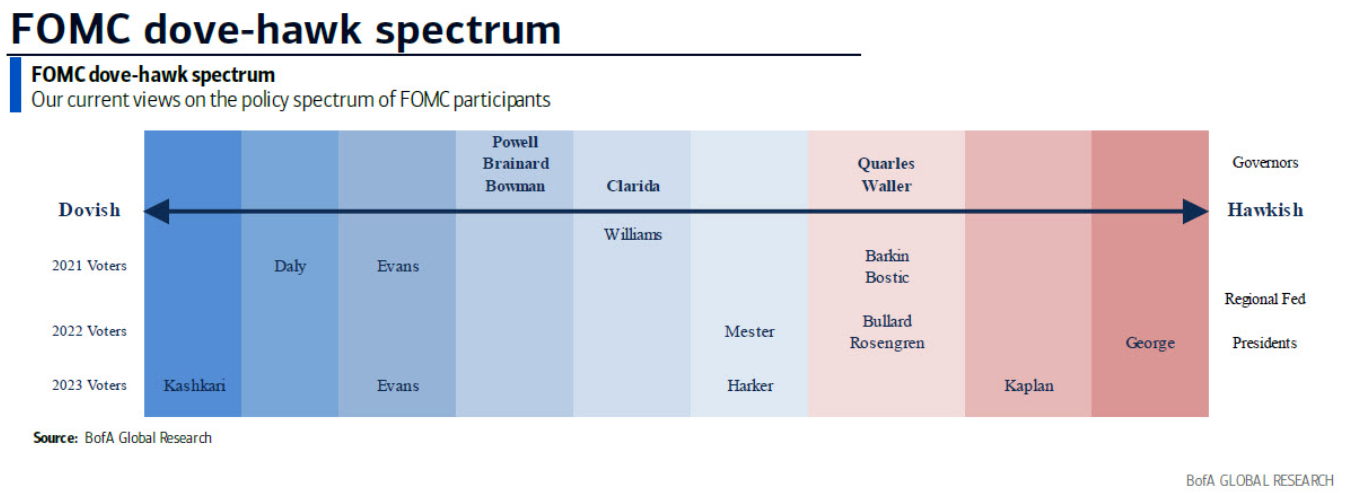
To explain, the graphic above depicts Bank of America’s FOMC dove-hawk spectrum. From left to right, the blue areas categorize the doves, while the red areas categorize the hawks. If you analyze the third, fourth and fifth columns from the left, you can see that Evans, Powell, Brainard and Williams are known for their dovish dispositions. However, with all four materially shifting their stances in the last week, the hawkish realignments are bullish for U.S. Treasury yields, bullish for the USD Index and bearish for the PMs.
For example, the U.S. 10-Year Treasury yield has risen by 19% over the last five trading days. What’s more, the U.S. 5- Year Treasury yield has risen by 24% over the last seven trading days and ended the Sep. 28 session at a new 2021 high. For context, the last time the U.S. 5-Year Treasury yield closed above 1% was Feb. 27, 2020.
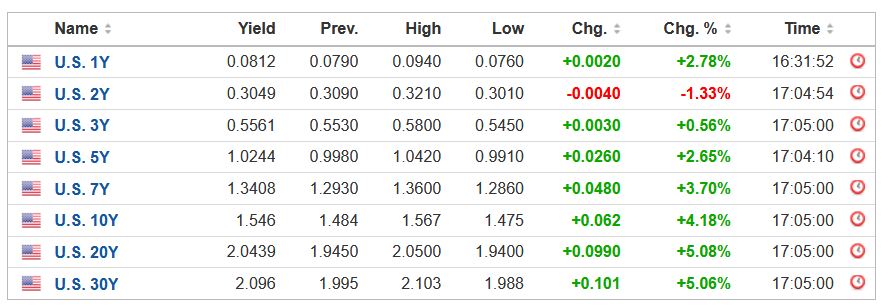
Source: Investing.com
On the opposite end of the double-edged sword slashing the gold price, the USD index is also reasserting its dominance. And with the greenback’s fundamentals also uplifted by higher U.S. Treasury yields, the current (and future) liquidity drains support a stronger U.S. dollar. For one, after 83 counterparties drained more than $1.365 trillion out of the U.S. financial system on Sep. 28, the Fed’s daily reverse repurchase agreements hit another all-time high.
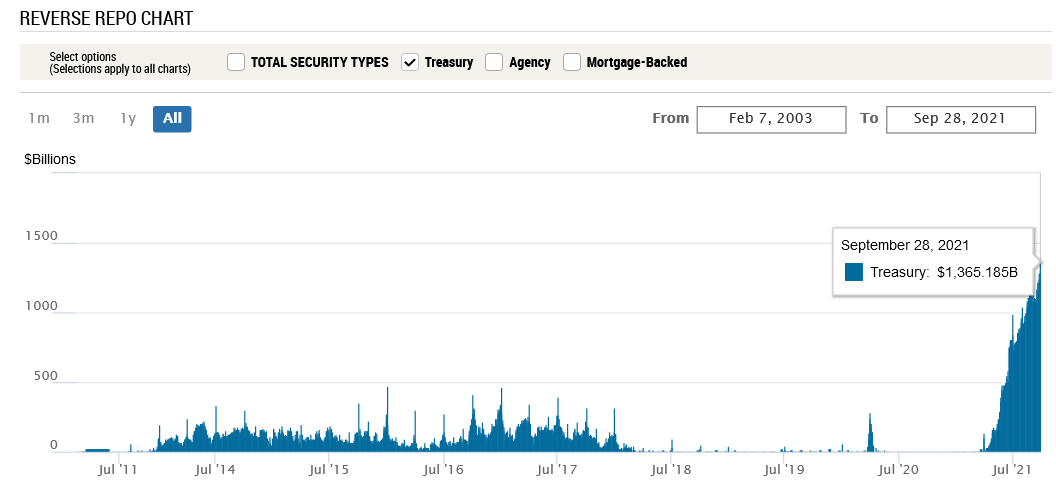
Source: New York Fed
To explain, a reverse repurchase agreement (repo) occurs when an institution offloads cash to the Fed in exchange for a Treasury security (on an overnight or short-term basis). And with U.S. financial institutions currently flooded with excess liquidity, they’re shipping cash to the Fed at an alarming rate. And while I’ve been warning for months that the activity is the fundamental equivalent of a taper – due to the lower supply of U.S. dollars (which is bullish for the USD Index) – as we await a formal announcement from the Fed, the U.S. dollar’s fundamental foundation remains robust.
Second, non-commercial (speculative) futures traders, asset managers and leveraged funds’ allocations to the U.S. dollar remain strong.
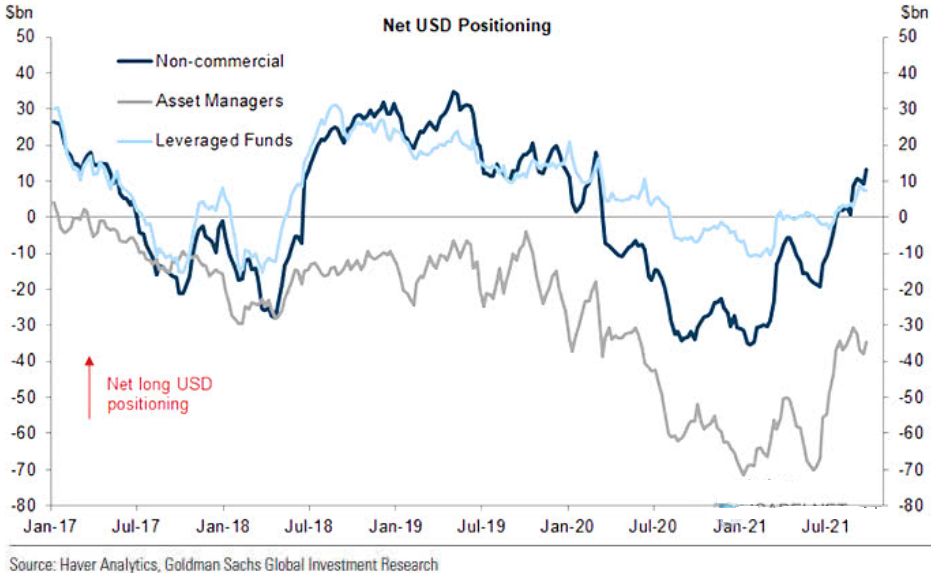
To explain, the dark blue, gray, and light blue lines above represent net-long positions of non-commercial (speculative) futures traders, asset managers and leveraged funds. When the lines are falling, it means that the trio have reduced their net-long positions and are expecting a weaker U.S. dollar. Conversely, when the lines are rising, it means that the trio have increased their net-long positions and are expecting a stronger U.S. dollar. And while asset managers and leveraged funds’ allocations (the gray and light blue lines) remain slightly below their 2021 highs, non-commercial (speculative) futures traders’ allocation to the U.S. dollar has now hit a new 2021 high. As a result, a continuation of the theme should uplift the U.S. dollar and negatively impact the performance of the gold and silver prices.
Finally, with the EUR/USD accounting for nearly 58% of the movement of the USD Index, the currency pair has sunk below 1.1700 once again. And with the Fed’s inflationary conundrum dwarfing Europe’s predicament, I warned on Jul. 20 that the dichotomy is bullish for the U.S. dollar.
I wrote: Not only is the U.S. economy outperforming the Eurozone, but the Fed and the ECB are worlds apart.
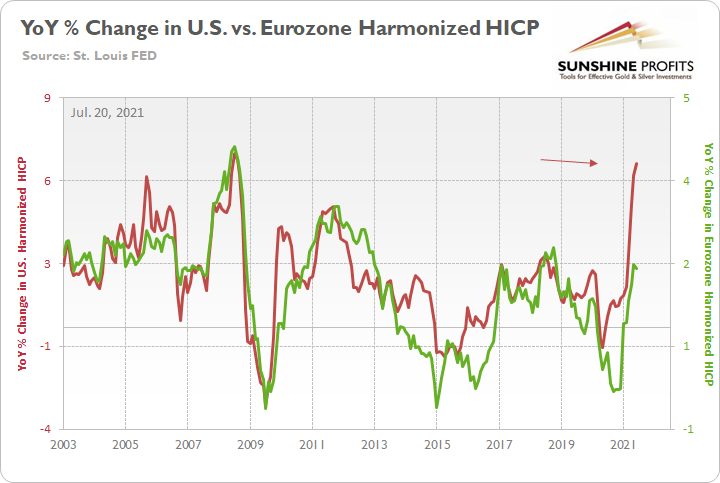
To explain, the green line above tracks the year-over-year (YoY) percentage change in the Eurozone Harmonized Index of Consumer Prices (HICP), while the red line above tracks the YoY percentage change in the U.S. HICP. If you analyze the right side of the chart, it’s not even close. And with the U.S. HICP rising by 6.41% YoY in June and the Eurozone HICP rising by 1.90%, the Fed is likely to taper well in advance of the ECB.
To that point, with the rhetoric above guiding the Fed down a hawkish path, the ECB is heading in the opposite direction. For example, ECB President Christine Lagarde said on Sep. 28 that there are “no signs that this increase in [Eurozone] inflation is becoming broad-based. The key challenge is to ensure that we do not overreact to transitory supply shocks that have no bearing on the medium term…. Monetary policy should normally ‘look through’ temporary supply-driven inflation, so long as inflation expectations remain anchored.”
As a result:
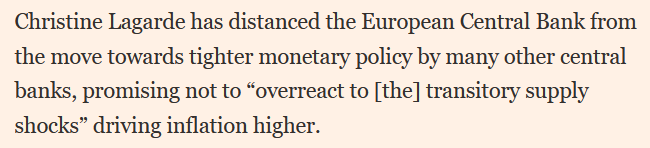
Source: the Financial Times
The bottom line? With U.S. Treasury yields and the USD Index firing on all cylinders, the PMs remain caught in the crossfire. And with both variables still having the fundamental wind at their backs, the Fed’s hawkish shift should help underwrite further gains over the medium term.
In conclusion, the PMs declined on Sep. 28 and the gold miners continued their underperformance. And with the Fed’s inflationary anxiety sparking a mini taper tantrum, the PMs remain stuck in no man’s land. Furthermore, with the general stock market also feeling the heat, a sharp correction could accelerate the ferocity of the PMs’ current downtrend. As a result, their medium-term outlooks remain quite bearish.
Want free follow-ups to the above article and details not available to 99%+ investors? Sign up to our free newsletter today!
Want free follow-ups to the above article and details not available to 99%+ investors? Sign up to our free newsletter today!
Author

Przemyslaw Radomski, CFA
Sunshine Profits
Przemyslaw Radomski, CFA (PR) is a precious metals investor and analyst who takes advantage of the emotionality on the markets, and invites you to do the same. His company, Sunshine Profits, publishes analytical software that any


