Dollar modestly higher; Japanese yen touches seven-month lows

Note: Charts provided by Trading View
EUR/USD:
Monthly timeframe:
(Technical change on this timeframe is often limited though serves as guidance to potential longer-term moves)
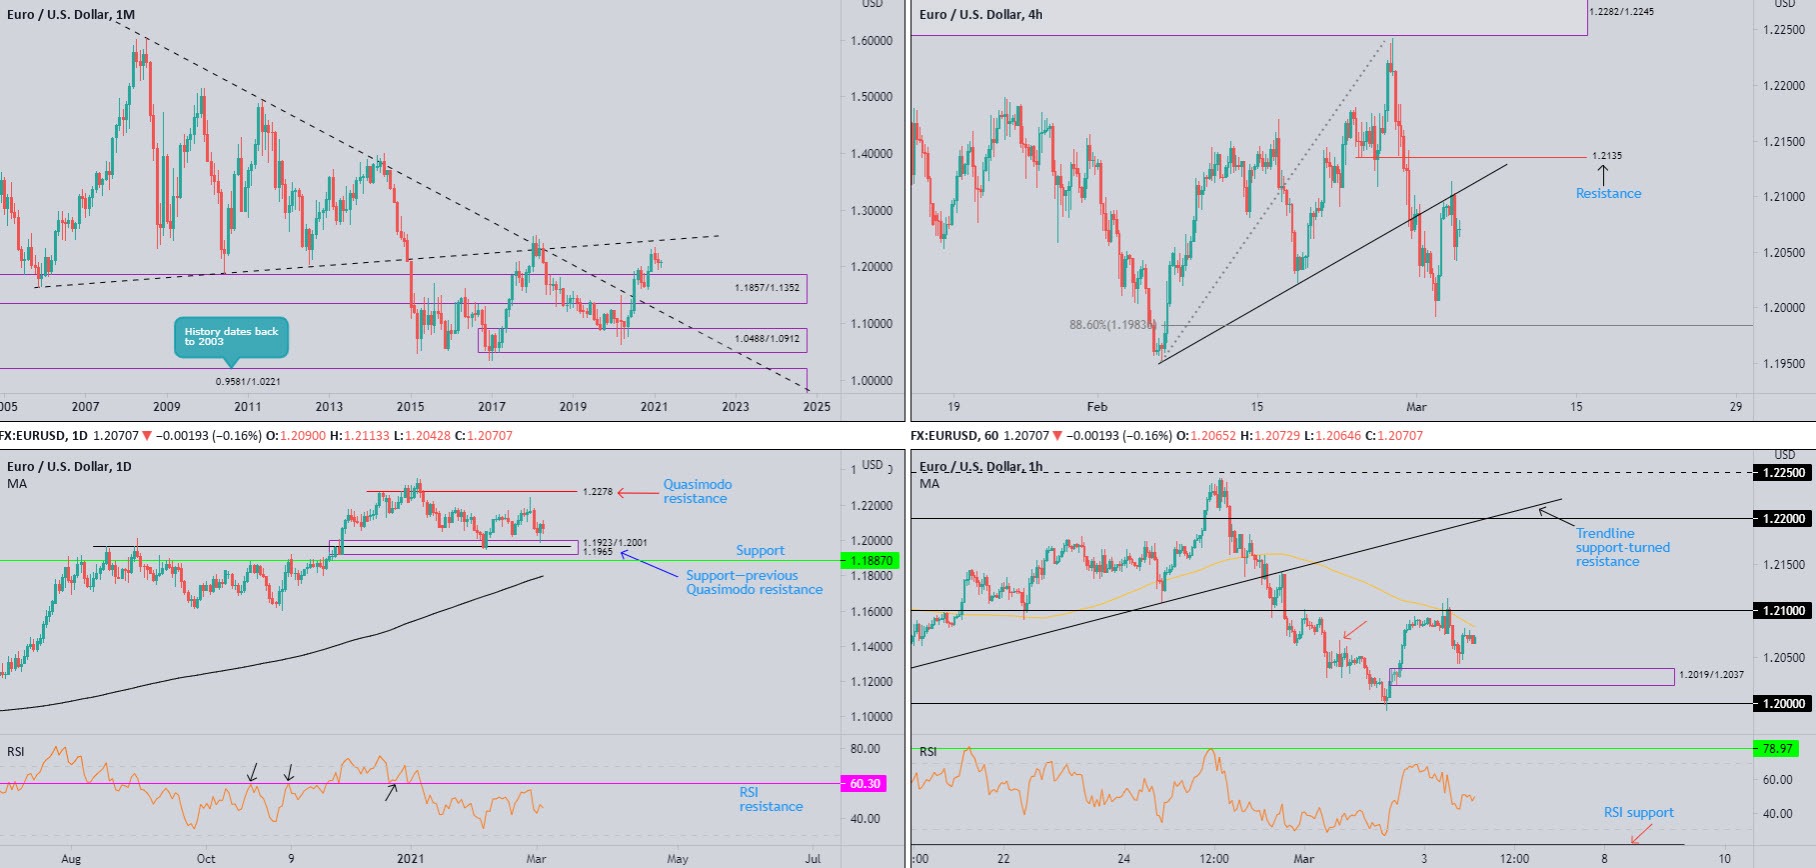
February, as you can see, eked out marginal losses (0.5 percent), ranging between 1.2243 and 1.1952.
Upriver, technical action suggests March could reach for ascending resistance (prior support – 1.1641), while lower on the curve 1.1857/1.1352 represents demand.
In terms of trend, the primary uptrend has been in play since price broke the 1.1714 high (Aug 2015) in July 2017.
Daily timeframe:
Partly modified from previous analysis –
Demand from 1.1923/1.2001 remains a central theme on the daily scale, a barrier housing support at 1.1965 (a previous Quasimodo resistance). However, amidst renewed DXY strength, EUR/USD upside decreased on Wednesday.
Despite the pause, Quasimodo resistance at 1.2278 remains in position to receive price should buyers regain consciousness.
The technical view from the RSI reveals the value treading water under the 50.00 centreline, with resistance parked relatively nearby at 60.30.
H4 timeframe:
H4 trendline support-turned resistance, an ascending line drawn from the low 1.1952, attracted bearish flow on Wednesday.
Target zones from the aforesaid trendline resistance could see the 88.6% Fib level at 1.1983 enter the fold, while a push higher may pursue resistance at 1.2135—a previous Quasimodo support.
H1 timeframe:
For those who read Wednesday’s technical writing you may recall the following (italics):
Shorter-term action recently unearthed 1.21 resistance on the H1 scale, along with the 100-period simple moving average, and H4 trendline resistance. As a result, sellers could make an entrance from the 1.21 region today and attempt to hold back daily buyers.
As evident from the chart, 1.21 did indeed make a show and invited a bearish presence, targeting demand pictured at 1.2019/1.2037. The latter is a reasonably important zone on this timeframe, having it been within this area a decision was made to break the 1.2068 peak.
The RSI, after dipping from overbought territory, is seen circling the 50.00 centreline.
Observed levels:
Short-term flow likely has eyes on H1 demand from 1.2019/1.2037. Traders considering a bullish position from this region may want to take into account that a possible whipsaw through the zone may emerge to test 1.20. Also, it may be worth noting that a bullish scenario is likely to be backed by daily action out of demand at 1.1923/1.2001.
AUD/USD:
Monthly timeframe:
(Technical change on this timeframe is often limited though serves as guidance to potential longer-term moves)
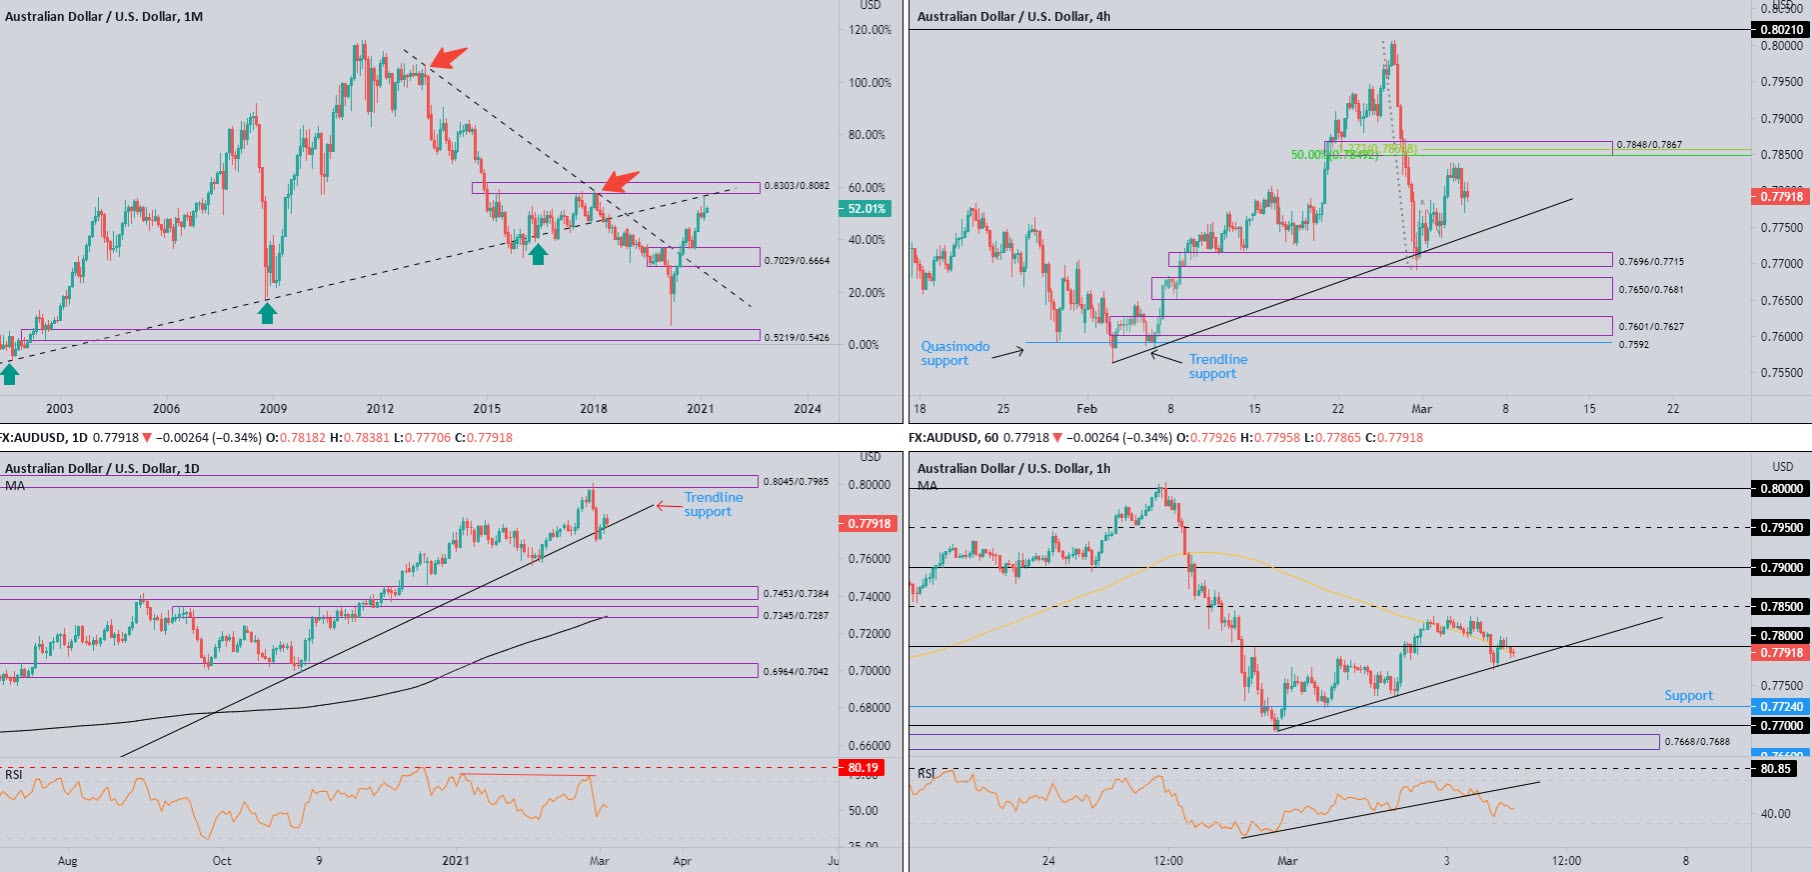
February finished considerably off best levels, forming what many candlestick fans call a shooting star pattern—a bearish signal typically found at peaks. Also interesting was price came within striking distance of trendline resistance (prior support - 0.4776), sheltered under supply from 0.8303/0.8082.
In the context of trend (despite the trendline resistance [1.0582] breach in July 2020), the primary downtrend (since mid-2011) remains in play until breaking 0.8135 (January high [2018]).
Daily timeframe:
Slowing down selling interest from the monthly timeframe’s bearish candlestick formation is daily trendline support, taken from the low 0.5506. As you can see, despite Wednesday’s modest retreat, this week has chalked up two back-to-back bullish candles off the trendline support.
Beyond trendline support, the technical radar falls on February 2nd low at 0.7563, with a break unmasking demand at 0.7453/0.7384 (prior supply).
In terms of trend on this scale, the unit has been convincingly higher since March 2020.
In addition to the above, the RSI is currently trekking the 50.00 centreline.
H4 timeframe:
Bearish bets emerged a few pips south of 0.7848/0.7867 supply on Wednesday, an area joined by a 50.0% retracement at 0.7849 and a 127.2% Fib extension at 0.7856.
Trendline support, taken from the low 0.7563, is marked as a possible downside objective if sellers make a firmer entrance, with subsequent selling to greet demand at 0.7696/0.7715.
H1 timeframe:
Wednesday’s mild decline drew candle action through the 0.78 figure to shake hands with trendline support, etched from the low 0.7692. Breaking this level potentially sets the stage for a short-term dip back to support at 0.7724 and possibly 0.77.
Above 0.78, 0.7850 resistance calls for attention.
The technical picture from the RSI shows the value breached trendline support and also dipped a toe south of the 50.00 centre line.
Observed levels:
With monthly implying that buying could slow, along with daily price struggling to attract much buying off trendline support, H4, with room to drop towards trendline support could guide H1 through respective trendline support, targeting H1 support at 0.7224.
USD/JPY:
Monthly timeframe:
(Technical change on this timeframe is often limited though serves as guidance to potential longer-term moves)
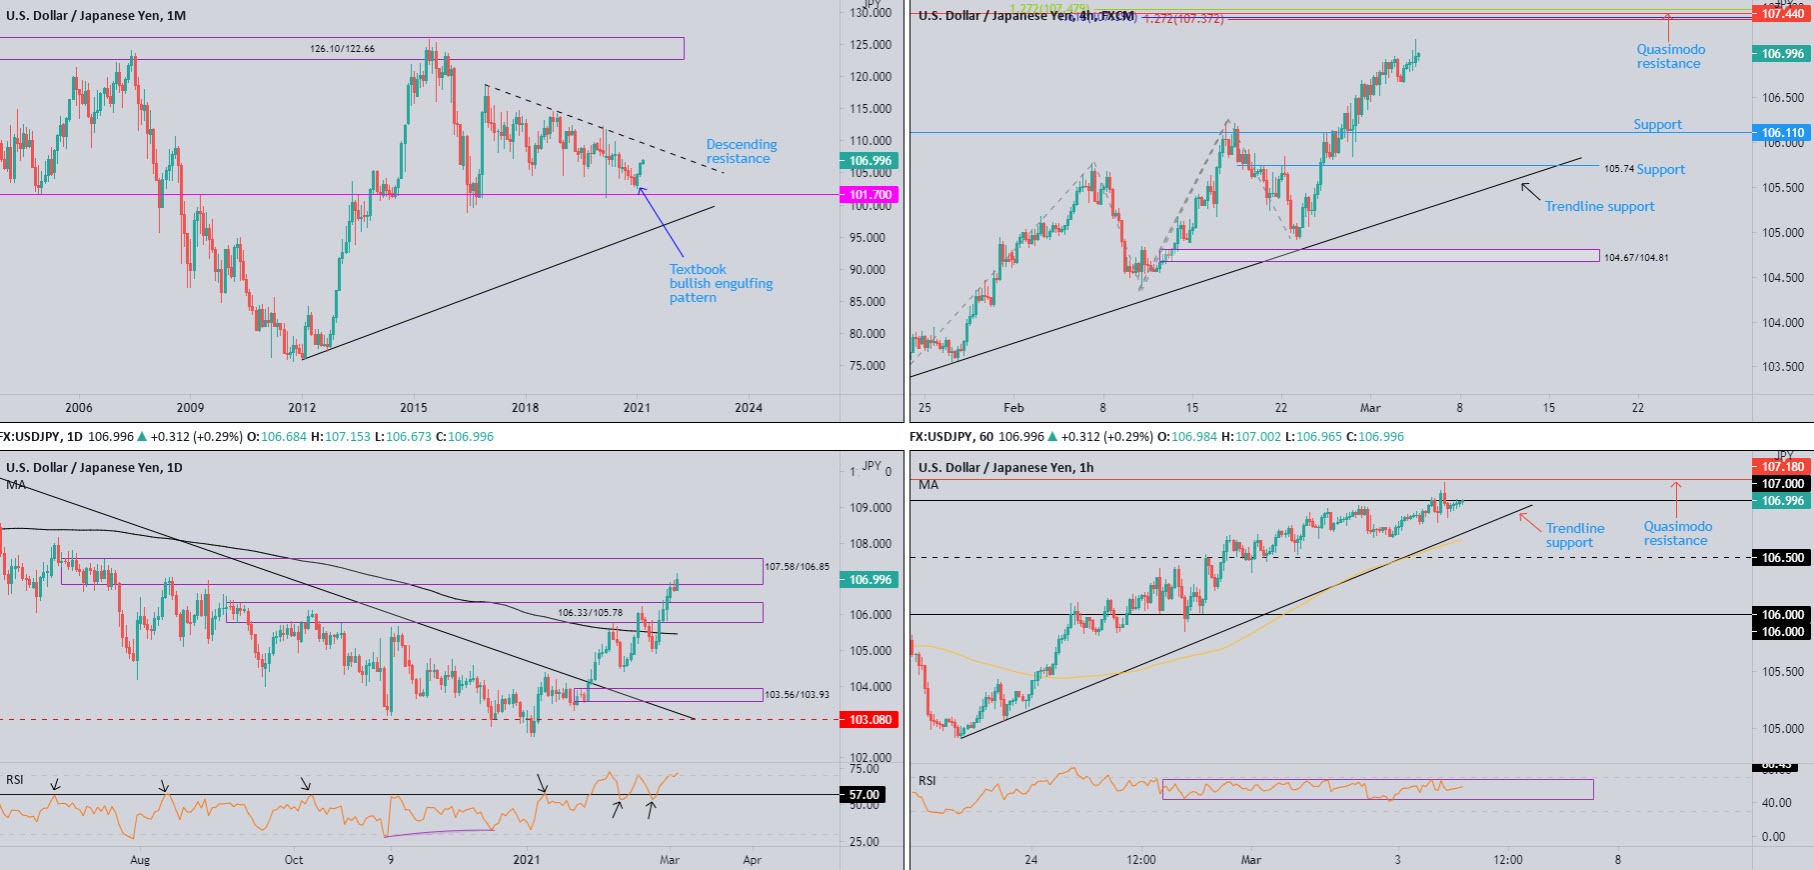
Following January’s bullish engulfing candle, price action printed further outperformance in February, adding 1.8 percent.
Descending resistance (not considered traditional trendline resistance) governs the spotlight to the upside, etched from the high 118.66, whereas support inhabits 101.70.
Daily timeframe:
Supply at 107.58/106.85, a base welcomed into the fight at the beginning of the week, has so far proved ineffective.
Rising US Treasury yields sparked a wobble in equities and ultimately reinforced demand for the greenback. This also witnessed the RSI indicator visit overbought terrain, following last week’s rebound from 57.00 support.
H4 timeframe:
With buyers still clearly at the wheel, this perhaps swings the pendulum towards a Fib resistance cluster between 107.47 and 107.37, a zone also complemented by Quasimodo resistance at 107.44.
Aside from Tuesday’s low at 106.67, support is not expected to make an appearance until around the 106.11 region.
H1 timeframe:
107 represented a key base on Wednesday, holding back upside attempts.
To the downside, trendline support, taken from the low 104.92, and the 100-period simple moving average, circle nearby territory, whilst above 107, Quasimodo resistance calls for attention at 107.18.
The RSI value continues to consolidate around the lower side of overbought space—common viewing in trending environments.
Observed levels:
Together with monthly price showing room to take on higher levels, and daily supply at 107.58/106.85 echoing a reasonably fragile tone, H4 is likely to make a run for the Fib resistance cluster between 107.47 and 107.37.
The above signals H1 is likely to overthrow 107 and Quasimodo resistance from 107.18, possibly triggering a short-term bullish theme.
GBP/USD:
Monthly timeframe:
(Technical change on this timeframe is often limited though serves as guidance to potential longer-term moves)
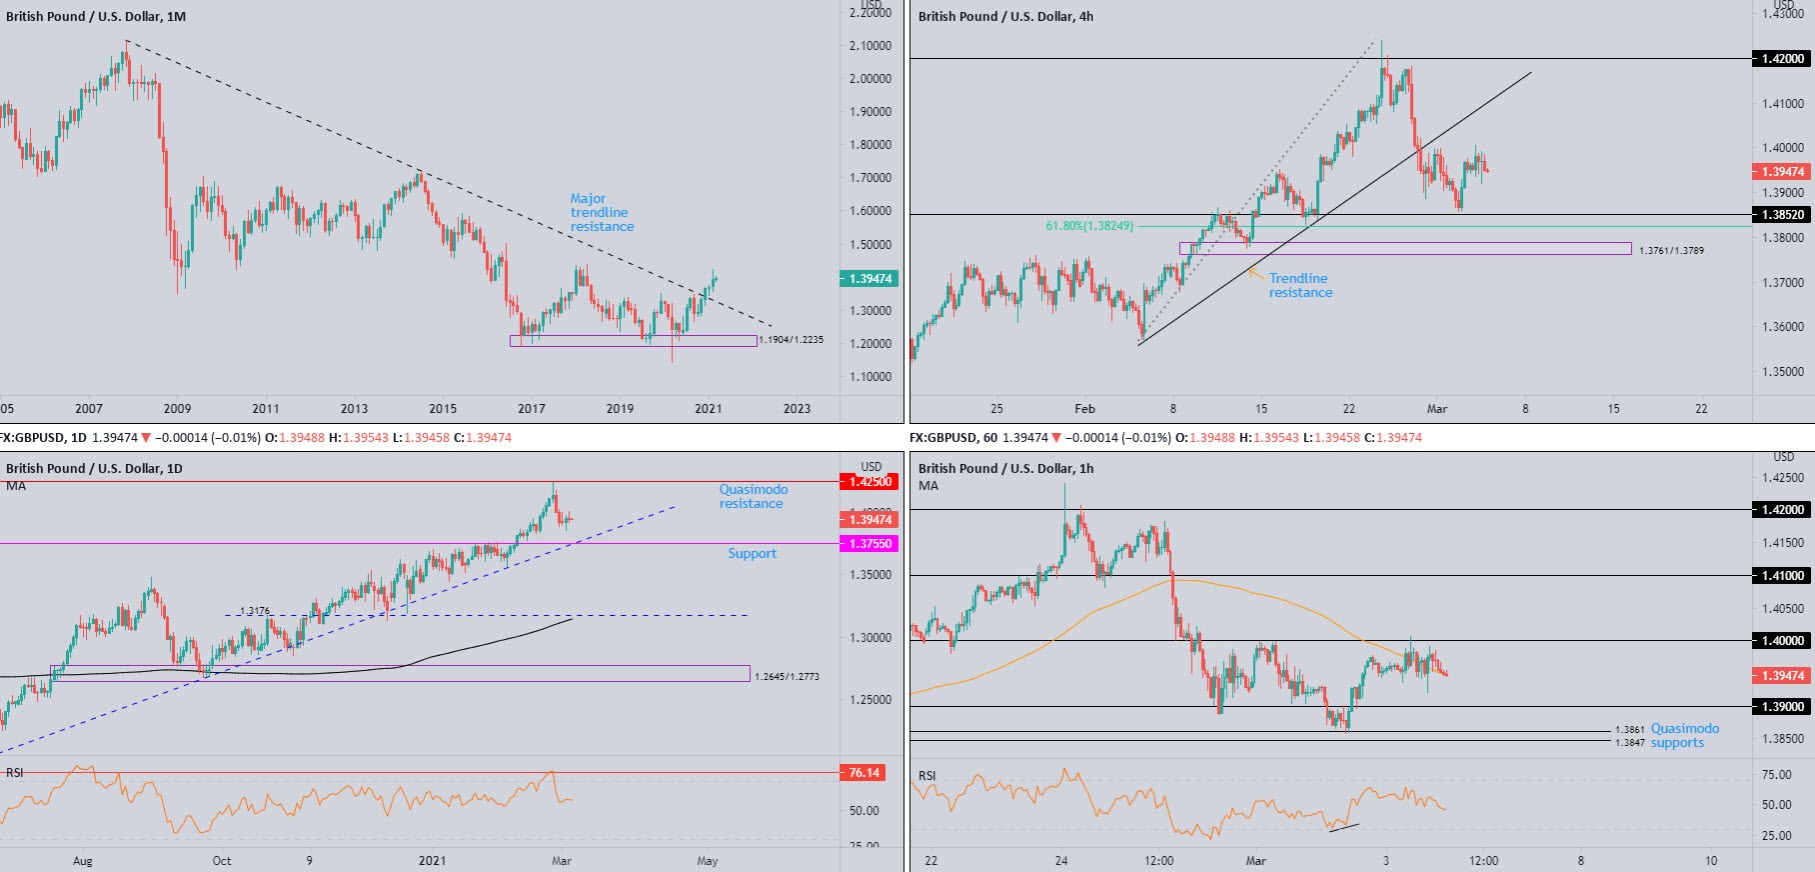
As seen from the monthly chart, the pendulum firmly swung in favour of buyers following December’s 2.5 percent advance—movement that stirred major trendline resistance (2.1161).
February followed through to the upside (1.7 percent) and refreshed 2021 highs at 1.4241, levels not seen for three years.
Despite the trendline breach, primary trend structure reveals the trend has faced lower since early 2008, unbroken (as of current price) until 1.4376 gives way—April high, 2018.
Given February’s movement, 1.4376 represents the next upside objective.
Daily timeframe:
Brought forward from previous analysis –
Limited change has been observed this week, forming back-to-back indecisive candles.
Last week established a top a few pips south of Quasimodo resistance at 1.4250, prompting a sharp slump heading into the latter part of last week.
Support at 1.3755 is now in the firing line, a level sharing space with trendline support, drawn from the low 1.1409.
As highlighted in previous writing, RSI resistance made an entrance at 76.14, capping upside since late 2017. Subsequent downside has driven the indicator to within striking distance of the 50.00 centreline.
H4 timeframe:
Wednesday left behind a somewhat muted tone, producing little to get excited about.
Support at 1.3852, therefore, remains a talking point on the H4 scale, accompanied by a neighbouring 61.8% Fib level at 1.3824. Also technically noteworthy is demand pencilled in from 1.3761/1.3789
Trendline support-turned resistance also remains visible to the upside, taken from the low 1.3566.
H1 timeframe:
Bids and offers were reasonably consistent yesterday, generating a narrow range around the underside of the key figure 1.40. Also involved in the action is the 100-period simple moving average.
1.39 shines bright as possible support to the downside on the H1 scale, with further bearish attempts to potentially retest Quasimodo supports at 1.3847 and 1.3861.
Also particularly noteworthy on the RSI indicator is the value spinning below the 50.00 centreline, suggesting momentum to the downside could gather traction and reach oversold levels.
Observed levels:
Partly modified from previous analysis –
On the bigger picture, as noted in previous writing, monthly suggests room to approach higher levels over the coming weeks until reaching the 1.4376 top. Before the above graces the charts, a retest of daily support at 1.3755 and intersecting trendline support could be on the cards, a move likely welcomed by dip-buyers.
Should short-term action dethrone 1.40, this implies buyers could be taking control and therefore may not witness a retest of daily support from 1.3755.
Another short-term scenario to watch out for is a whipsaw through 1.39 into H1 Quasimodo supports mentioned above at 1.3847/1.3861. The H1 close back above 1.39 is movement often welcomed by traders (in this case, buyers).
Premium
You have reached your limit of 3 free articles for this month.
Start your subscription and get access to all our original articles.
Author

Aaron Hill
FP Markets
After completing his Bachelor’s degree in English and Creative Writing in the UK, and subsequently spending a handful of years teaching English as a foreign language teacher around Asia, Aaron was introduced to financial trading,


