Dollar gains on higher yields as a dovish Carney hits sterling

Market Overview
With the inflationary implications of commodity prices gaining strongly in recent sessions and geopolitical risk fading (for now) there has been a set up for global bond yields to push strongly higher. Subsequently the US 10 year Treasury yield has suddenly spiked above 2.90% and to levels not seen since the FOMC rate hike in March. The speed of this rise has allowed the yield curve to steepen slightly (2s/10s spread has pushed out from 43bps earlier this week up to 47bps) and this has helped the dollar find a bid. How long this push higher in Treasury yields last for could determine the near term strength of the dollar. However the rally has been assisted by dovish comments from the Bank of England’s Governor Mark Carney, who said in an interview to the BBC that markets should not get too far ahead of themselves in expecting a rate hike in May. Although he expects a hike in 2018 there are plenty more meetings this year. Sterling has been hit hard by Carney’s comments which surely now put paid to any talk of multiple rate hikes in 2018 from the BoE. Carney, previously labelled the “unreliable boyfriend” has a reputation of playing guidance a bit loose with his comments and this is certainly not going to endear him to the markets which had previously been guided towards expecting a rate hike next month.

Wall Street closed lower last night with the S&P 500 -0.6% at 2693, and with Wall Street futures slightly off today, Asian markets were mixed to lower (Nikkei -0.1%). This is driving another mixed open on European markets although the sterling weakness is helping the FTSE 100 to outperform today. In forex, the momentum of higher Treasury yields is still helping dollar strength, whilst sterling is under pressure following Mark Carney’s dovish comments, whilst the underperformance of the New Zealand dollar continues. In commodities, the recent dollar strength is also pulling the gold price slightly weaker and oil also off.
It is a relatively quiet day for economic announcements today, however there are a number of central bankers to keep an eye out for. For the data, Canadian inflation for March is at 1330BST and is expected to increase by +0.4% on the month, with the Year on Year data increasing a touch to +2.4% (from +2.2%). Eurozone Consumer Confidence is at 1500BST and is expected to drop back into negative territory at -0.2 (+0.1 last) after five months of extremely rare moves into positive territory. As for the central bankers, in the morning the Bank of England’s Michael Saunders (tends to lean a touch hawkish) is at 1030BST, whilst perma-hawk Bundesbank President (and potential candidate to replace Draghi at the end of his tenure in October 2019) Jens Weidmann speaks at 1230BST. Into the afternoon, the FOMC’s John Williams (voter, hawk) speaks at 1615BST.
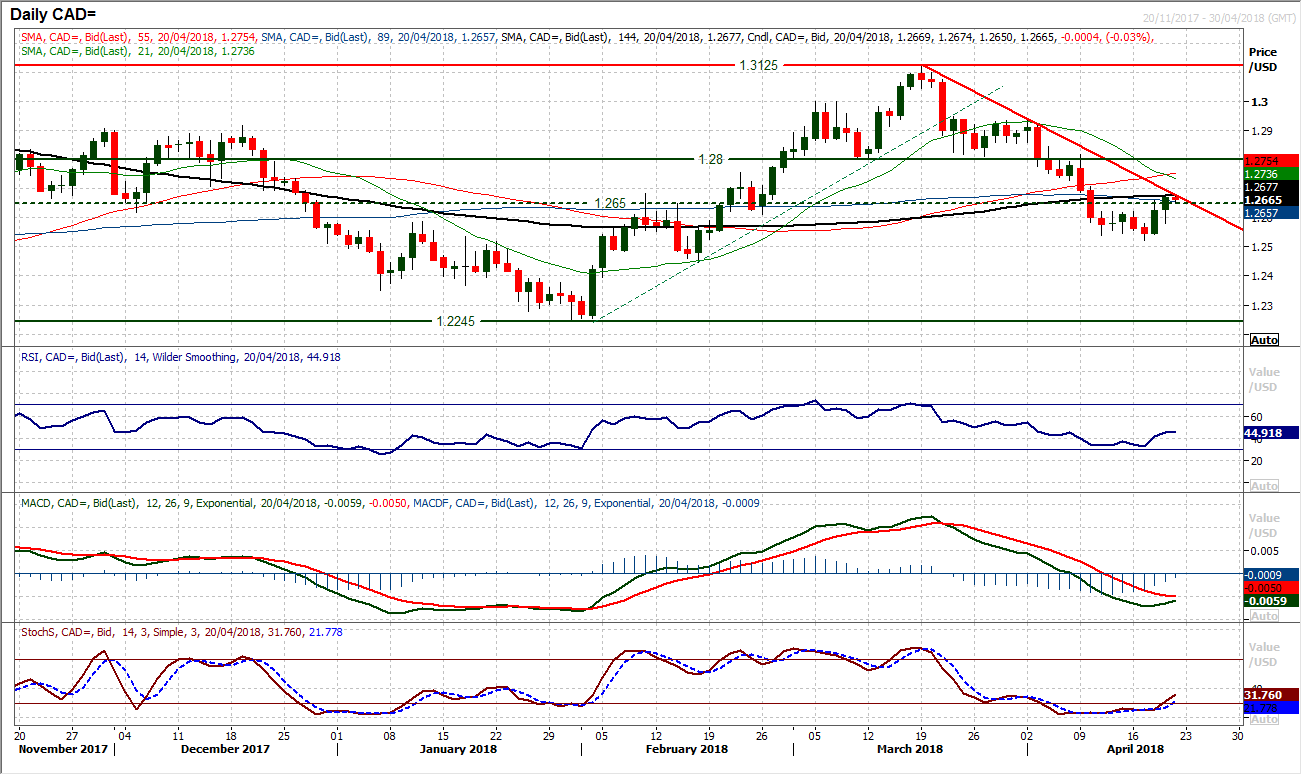
Chart of the Day – USD/CAD
The Canadian dollar has been strengthening in recent weeks and a strong downtrend has formed. The top pattern completed below 1.2800 implies a 325 pip correction back to 1.2475. Although the market rebounded this week from 1.2520 there is still an expectation that there is further downside potential. However with the market having unwound to the downtrend resistance, the moves in the next couple of sessions could be key. The momentum indicators have ticked higher in the wake of two strong bull candles, and the Stochastics have posted a positive signal. However, the RSI and MACD lines are yet to confirm this and if the RSI fails to recover back above 50 on a sustainable basis then the negative pressure will remain. Reaction around the pivot c. 1.2650 dating back to August 2017 will also be key, as a failure around current levels will again look to reassert bear control. The downtrend falls today around 1.2680 today and as the “the trend is your friend, until it ends” this move still looks to be a chance to sell. A retest of 1.2520 and then towards the 1.2475 target remains likely on a failure of this rebound.
EUR/USD
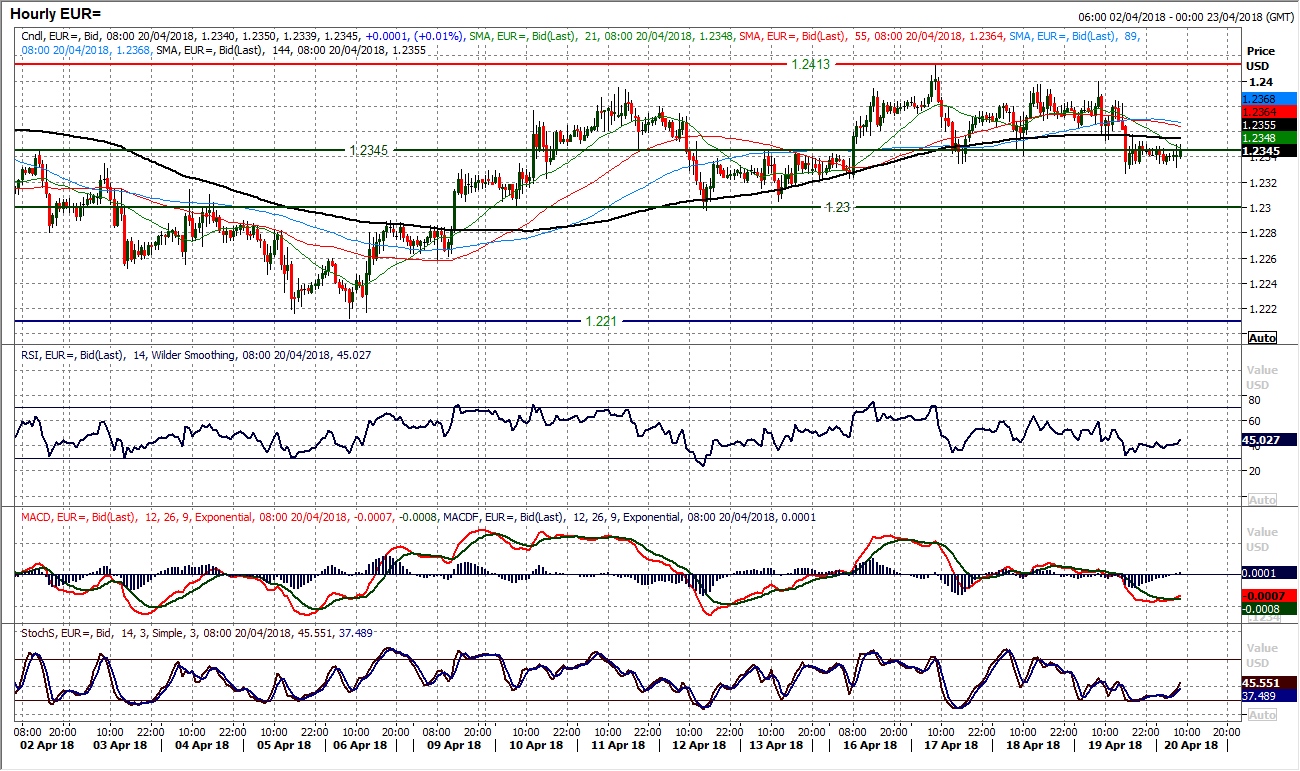
At some stage the euro will find some direction, but seemingly not for now. The mild bull bias that has seen the market edge higher in the past couple of weeks seems to be tailing off once more. After a couple of very muted candles earlier in the week, yesterday’s 26 pip drop has dragged the market once more back to test the support of the longer term uptrend that comes in at $1.2320 today. This looks to be put paid to any real sense that the euro bulls were starting to make gains once more within the 400 pip range. The market is subsequently back to almost entirely in the middle of the $1.2155/$1.2555 range in place since the beginning of the year. Momentum indicators remain stagnant and moving averages plateauing. The support at $1.2300 will now be in focus today. The hourly chart shows a retreat to the pivot around $1.2345 which is effectively a neutral point now. Resistance at $1.2400/$1.2410 is subsequently growing in importance.
GBP/USD
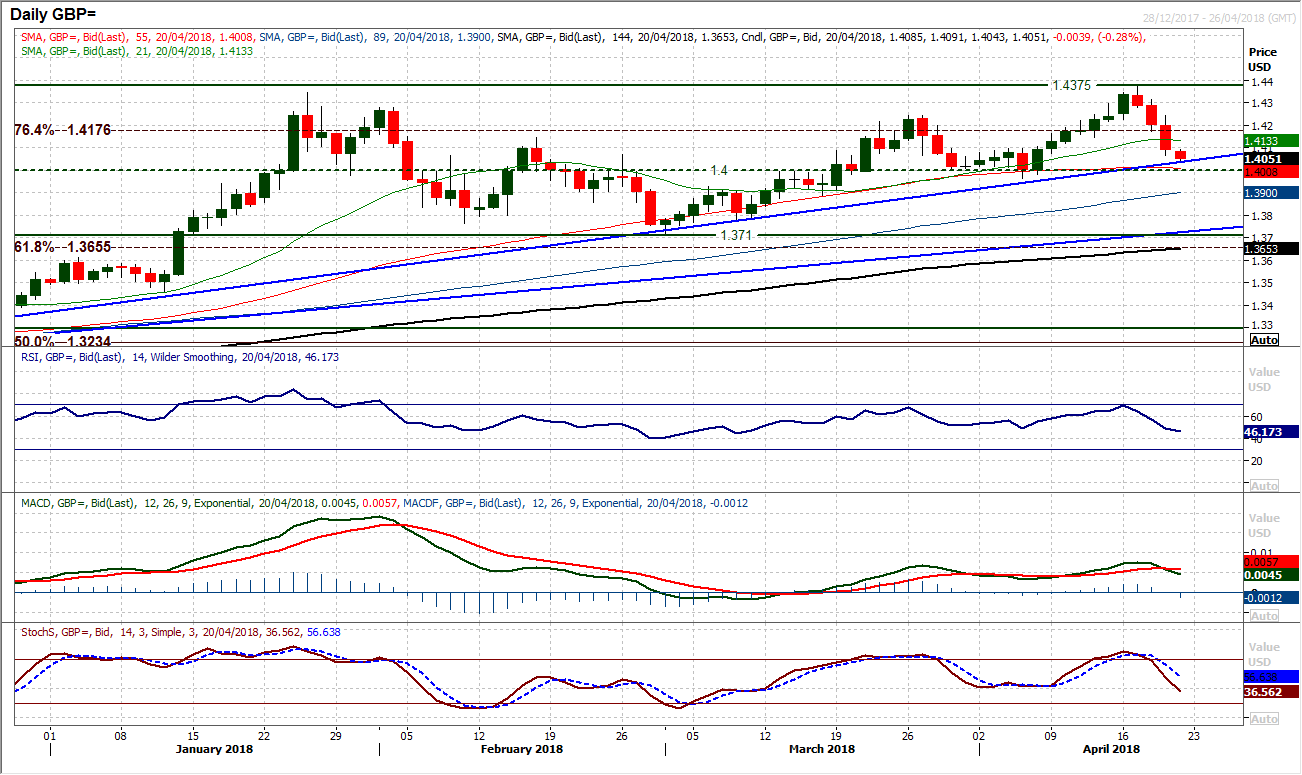
Cable looked to be stabilising yesterday until Mark Carney’s dovish comments hit the market by over 100 pips late in the session to close strongly down on the day. This is a third bear candle in a row which has pulled the pair back to the rising support of the 5 month uptrend (today coming in at $1.4040). Corrections within this uptrend have continually been used as a chance to buy and once more this is likely to be the case. There is a basis of support around $1.4000 (above the $1.3965 low) which will be an area where the bulls look to buy on support now. Momentum indicators have unwound but this comes within the bullish medium term configuration and again this looks to be a chance to buy once the market settles down. It will be interesting to see how the European market trades Cable today as the hourly chart shows after the initial knee jerk reaction lower last night, the market has begun to settle down. Initial resistance come in the previous resistance band initially at $1.4100 and then $1.4150. Making progress back through these levels would be a signal of intent again from the bulls.
USD/JPY
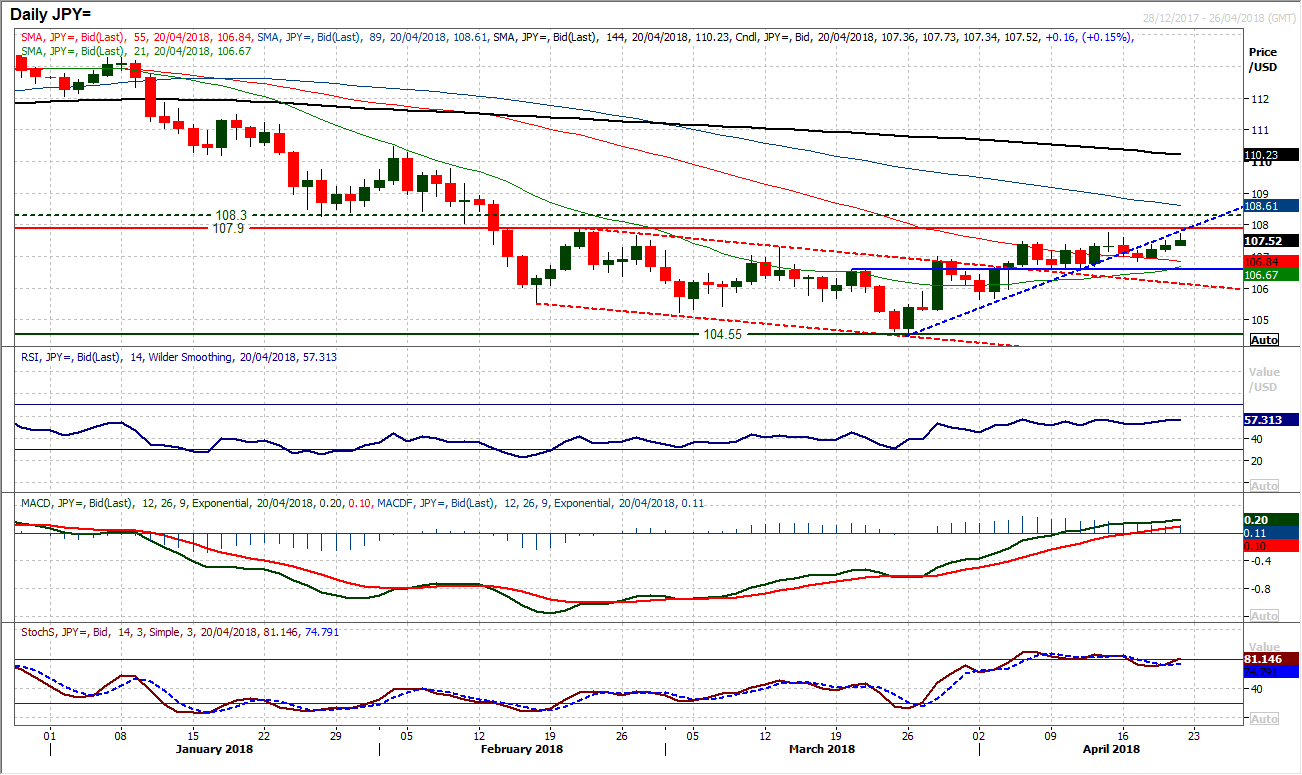
There seems to finally be something building for the dollar bulls after more than two weeks of consolidation. A couple of positive candles have been posted in the last two days and with today’s early gains there has been an improvement in momentum. The market is again testing last week’s high of 107.77 but more importantly the 107.90 is once more within sight. The market left the 106.60 support and a higher low at 106.85 earlier this week and the market seems to be pulling mild higher highs within this recent consolidation. The momentum indicators are ticking higher once more and there is upside pressure building and a positive bias now. The hourly chart reflects this with a run of higher lows in the past few days and positive momentum configuration. The key moment for the bulls would be a confirmed breakout above 107.90 which would open the next trading band resistance from earlier this year between 108.30/110.50. Can the bulls finally break the shackles today?
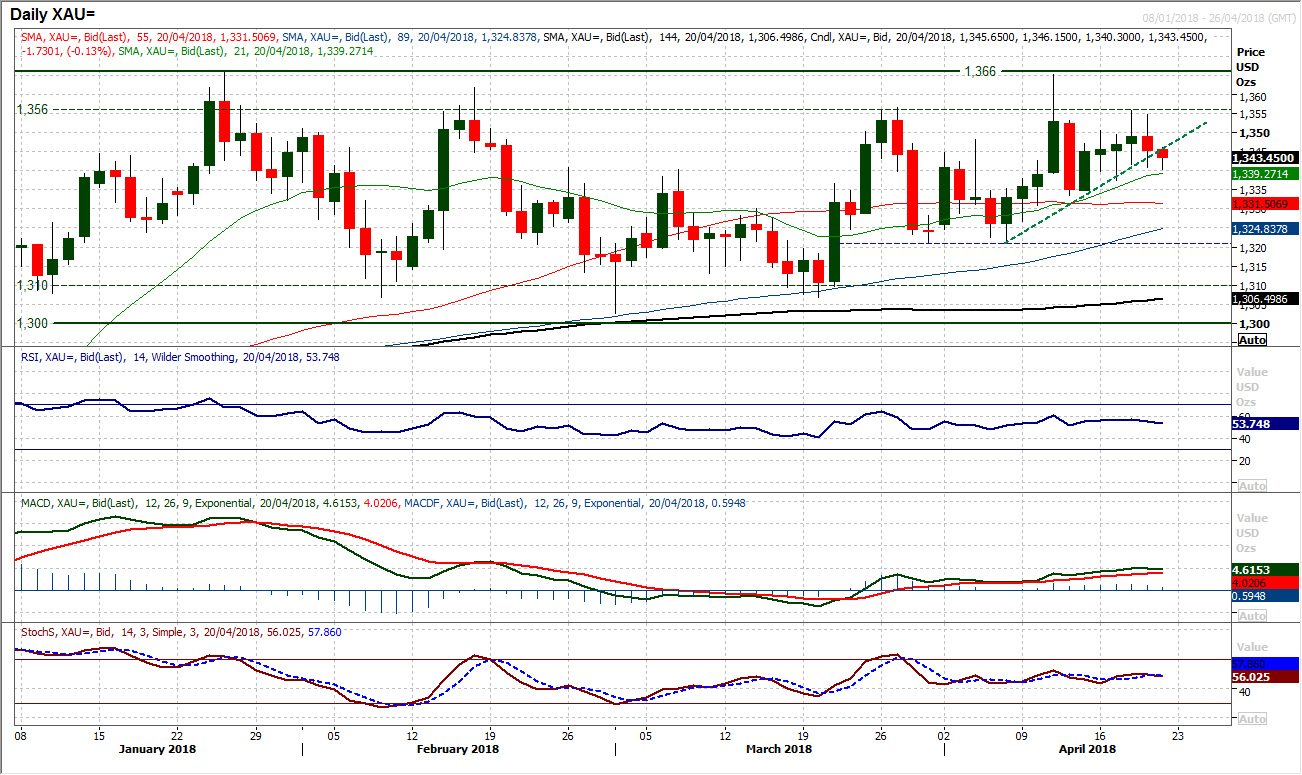
Gold
Whilst commodities have seen significant gains in recent sessions, gold has been unable to partake. As the dollar has strengthened and risk appetite improved, the gold price has started to drop back. Yesterday’s negative close is being followed by early weakness today. It is also interesting to see that once more, the price seems to be failing at the resistance band $1356/$1366, with the last two sessions showing the market having a look but just not fancying the effort. Subsequently the short term uptrend of the past two weeks has been broken and momentum indicators are tailing off again. There have been a run of higher lows in the last two weeks and the first test of support is at $1337, above $1333.50 and then the key near term support at $1321. The hourly chart shows the bulls having lost the impetus in the run, with hourly moving averages all rolling over and momentum indicators more negatively configured. There is a near term pivot at $1347 below the resistance that continues to build at $1356.
WTI Oil
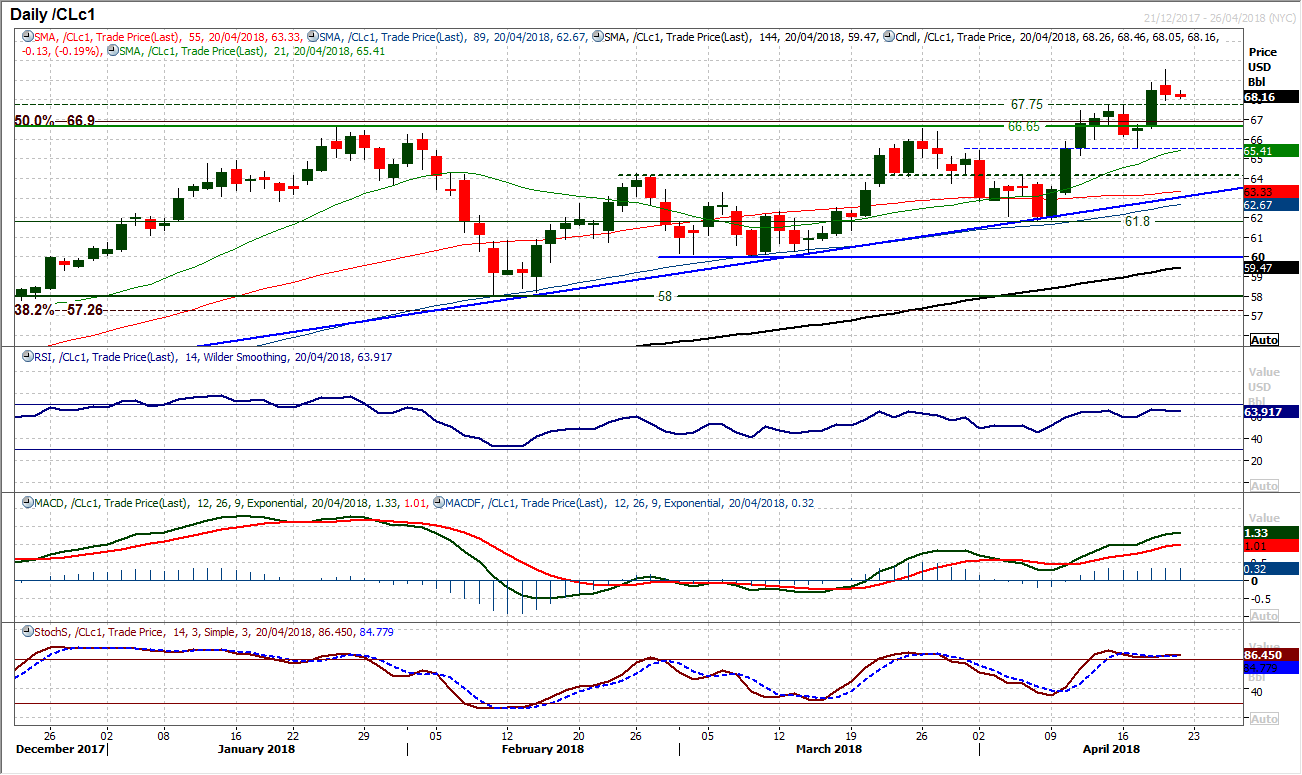
A breakout to new multi-year highs is showing the first signs of fatigue as a negative candle formed into the close yesterday. However the bulls will look at the continued positive configuration on the daily momentum indicators whilst the hourly chart suggests this slip is an unwinding move. The support band of the recent breakouts will be seen as a band of support $66.65/$67.75 that is now a near term buy zone and there is an expectation that the bulls would be watching for the next buy trigger. Yesterday’s high at $69.55 is initial resistance with $70 a key psychological level to overcome. The higher low at $65.55 is becoming increasingly important now.
Dow Jones Industrial Average
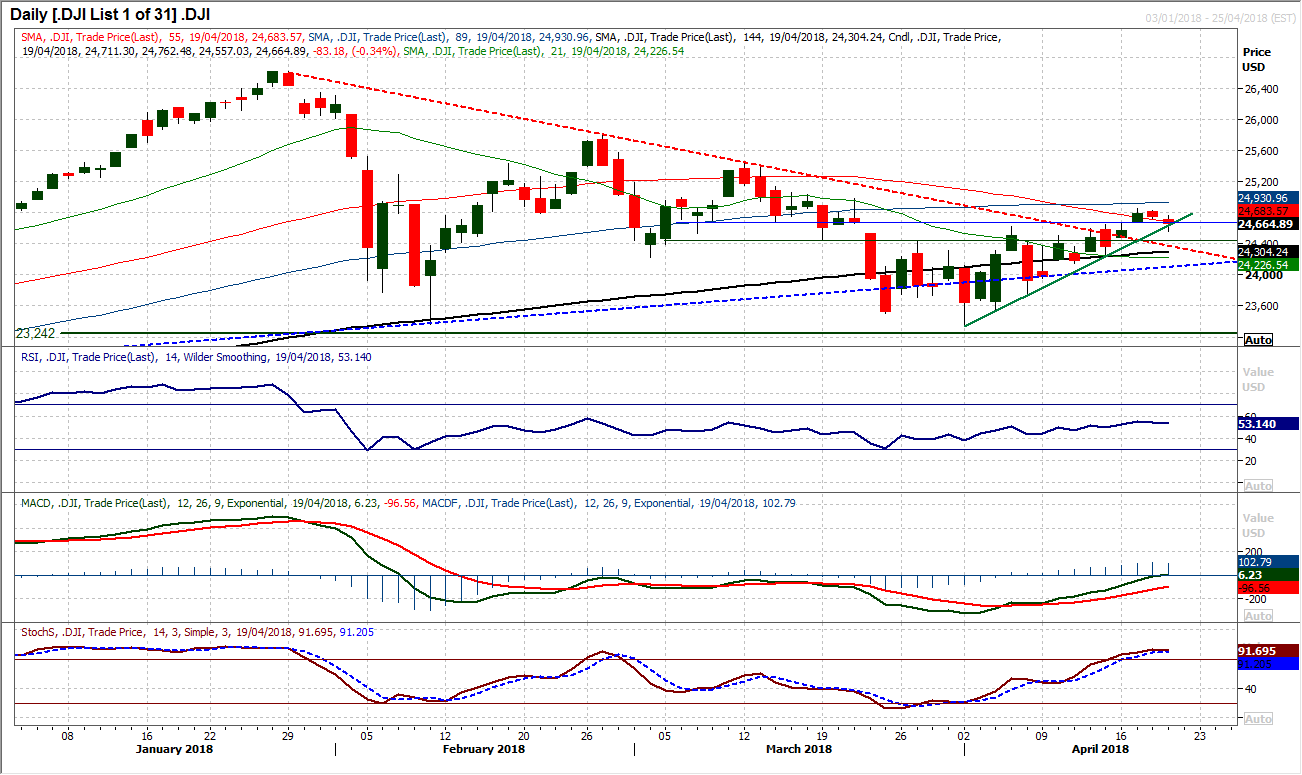
The market has just taken a pause for breath in the past couple of sessions as a drop back towards the uptrend support of the past couple of weeks. However this still looks to be just an unwinding move, with the 24,450/24,650 old pivot band now supportive. Yesterday’s candle dipped into this support band again, but interestingly the mini rally into the end of the session resulted in a close back above the support. However, it is important that the bulls do not leave it too long to wake up once more as a third corrective session would begin to look for like a trend. So far the momentum indicators remain positively configured in their recovery, but the Stochastics are just beginning to roll over and this is a warning for the bulls. The hourly chart reflects the slight unwind of the bullish outlook, whilst the RSI and Stochastics look set to improve again. Initial resistance from Tuesday’s high is at 24,858 protecting a reaction high at 24,979 whilst the March high is still key at 25,450. A loss of the pivot support at 24,450 would now be a disappointment for the bulls.
Author

Richard Perry
Independent Analyst


