Market Overview
There has been a significant shift in sentiment on the dollar in the past 24 hours and a move that questions the strength of the dollar rally. In the wake of Friday’s stronger than expected Retail Sales and Michigan Sentiment the dollar looked to be on a roll. But how quickly things change with the gains being wiped out by several factors. The sharp drop on the New York Fed manufacturing data has shown the volatility in the economic data and the dollar has sold off. With the dollar weakening, the attention will turn to US CPI inflation today as to what it will do for expectations of a June hike (which are currently very much not priced in – around 4% probability according to CME’s FedWatch) Improved prospects for the UK Remain camp in the Brexit debate have also bolstered risk appetite for sterling. Furthermore, a less dovish than expected set of meeting minutes from the Reserve Bank of Australia question the willingness to follow up the recent interest rate cut with another, sending the Aussie dollar sharply higher.
Wall Street posted decent gains into the close last night with the S&P 500 up 1.0% suggesting that once more, data that prevents the Fed from hiking is supportive for equities. The strength of the oil price has certainly helped to also drive equities higher and these gains have pulled Asian markets along for the ride, with the Nikkei 225 up 1.1%. European markets are also reacting higher today. In forex markets there is a risk-on approach to the early moves with the commodity currencies performing well, led by the Aussie, whilst sterling also continues to make ground. There is a slight bullish bias on Dollar/Yen but the breakout is still yet to be achieved.
Markets will be looking out for inflation today and Cable could be especially volatile with both the UK and US announcing CPI. The UK CPI is at 0930BST with headline year on year expected to remain at +0.5% whilst the core data is expected to drop to +1.4% (from +1.5%). The US CPI data is released at 1330BST and the headline is expected to rise to +1.1% (from +0.9%) but interestingly the core data is expected to drop back slightly to +2.1% (from +2.2%). US Building Permits are at 1330BST also, with an expectation of 1.13m (1.09m last) with Housing Starts also at the same time expected to be 1.13m (1.09m last).
Chart of the Day – Silver
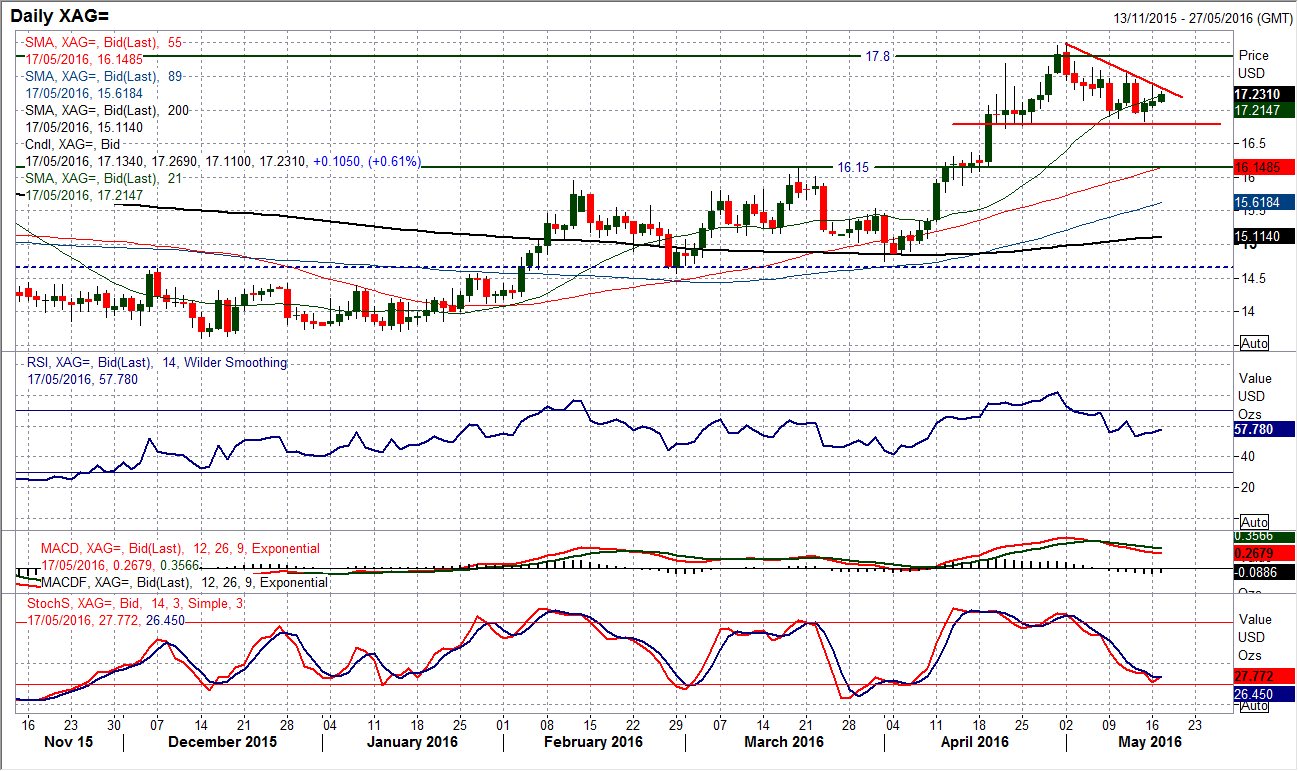
Has the correction on the precious metals played out already, or is there more to go on the near term downside? The silver price has pulled back from the key overhead supply and long term resistance at $18.00 for the past couple of weeks in a move that has unwound the RSI from an extremely overbought 82, back towards 50 where it has started to pick up again. The Stochastics have unwound but in the past week the price has been moving into more of a choppy consolidation between $16.83/$17.58. Yesterday’s rather disappointing sell-off into the close reflected that, although there has been a degree of support re-entering overnight. However the corrections of February and March unwound more than the current move, which means either that there is more to go, or the bulls are so strong that they are now willing to jump back in far earlier. The hourly chart shows that the hourly MACD lines turned lower yesterday and the RSI has turned lower along with the Stochastics. This could mean that another near term lower high could now be in place at $17.39 below the $17.58 high from last week. The support around $16.80 is key from a medium term perspective with this being a potential large top pattern neckline. A breach would imply $1.20 of downside to $15.60. The chart of gold (see below) may be forming some good support, but silver is underperforming and there are big questions over the current outlook.
EUR/USD
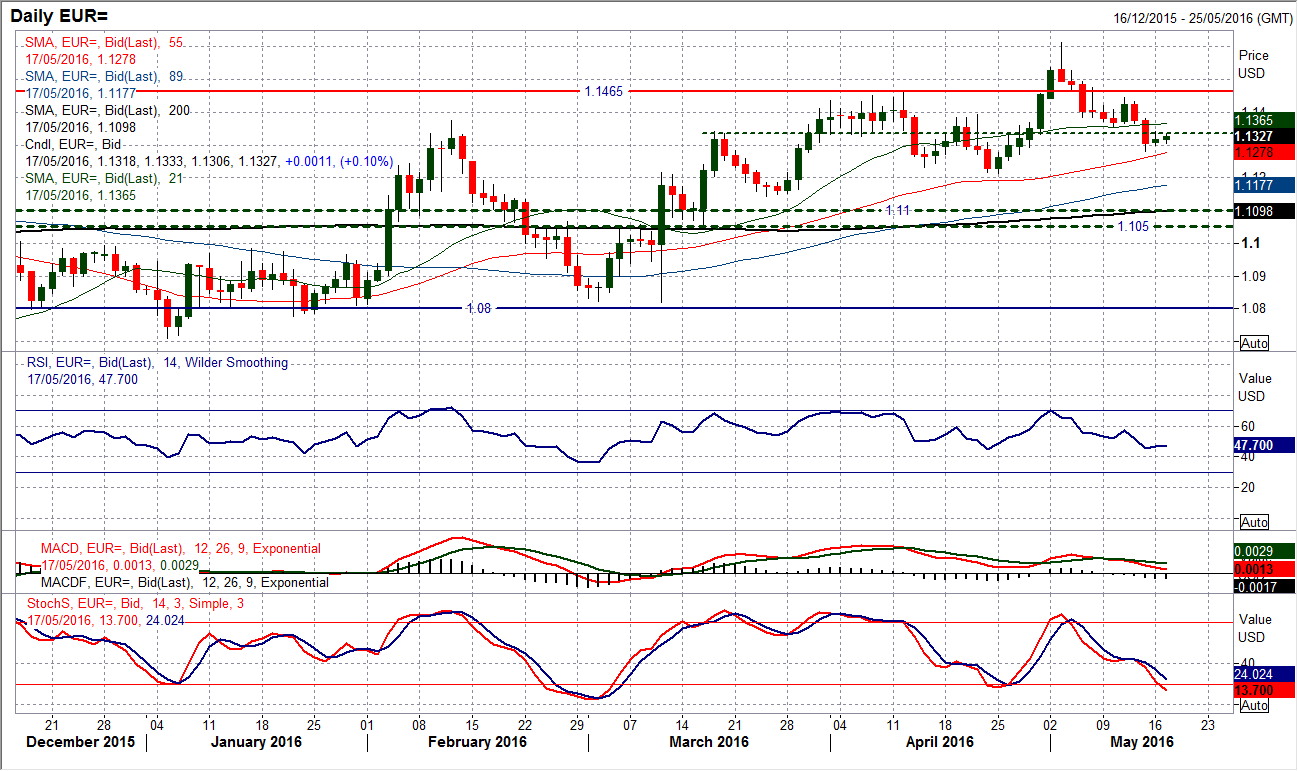
The euro is just beginning to consolidate a touch after the late sell-off last week which resulted in a breakdown of the support band around $1.1330/$1.1360. This comes as the RSI is once more back to a level reached during the April decline to $1.1213. Furthermore, the Stochastics are also at a similar level to the April decline. That would suggest this consolidation is an important phase for the euro. It is also interesting that the last three corrections of March and April all found support above the 55 day moving average (currently $1.1277) which is basically at the support from Friday now which left a low at $1.1280. The breach of the 55 day ma would therefore signify a confirmed shift in the outlook and would open $1.1213 but also likely to result in a drag back to $1.1100 which is the old long term pivot. The previous support band $1.1330/$1.1360 is an area of resistance near term. The bulls would re-assert above $1.1445.
GBP/USD
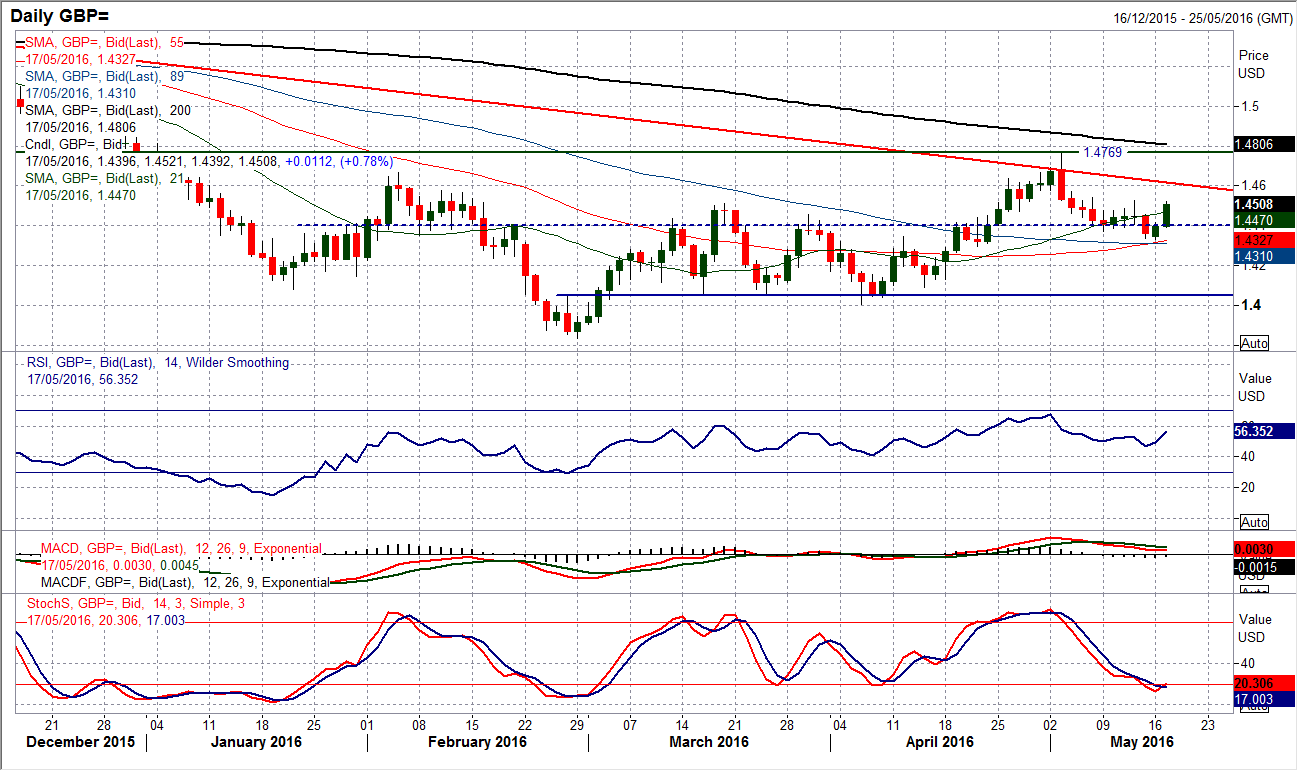
Is this another turning point for Cable? The bulls have returned with some gusto in the past 24 hours and added over 150 pips. This has resulted in a bull candle formation yesterday which helped to retrace much of Friday’s bear candle, however the buyers have not stopped there and continued into today. This is an incredible move for a currency pair that had only just broken below a key support on Friday, but the support now left in place at $1.4330 has now bolstered the reaction low at $1.4300. The technicals are very interesting here because the Stochastics are now on the brink of giving a buy signal and it should be kept in mind how the price reacted strongly to the buy signals of February, March (to a lesser extent) and April. The RSI is still positively configured and this could actually be a positive medium term signal the bulls have been waiting for. The fundamentals (ie. Brexit volatility) might make it difficult for Cable to trend, but the techncials have certainly improved. The hourly chart shows the key resistance is $1.4530 whilst there is a near term support band now $1.4400/$1.4450.
USD/JPY
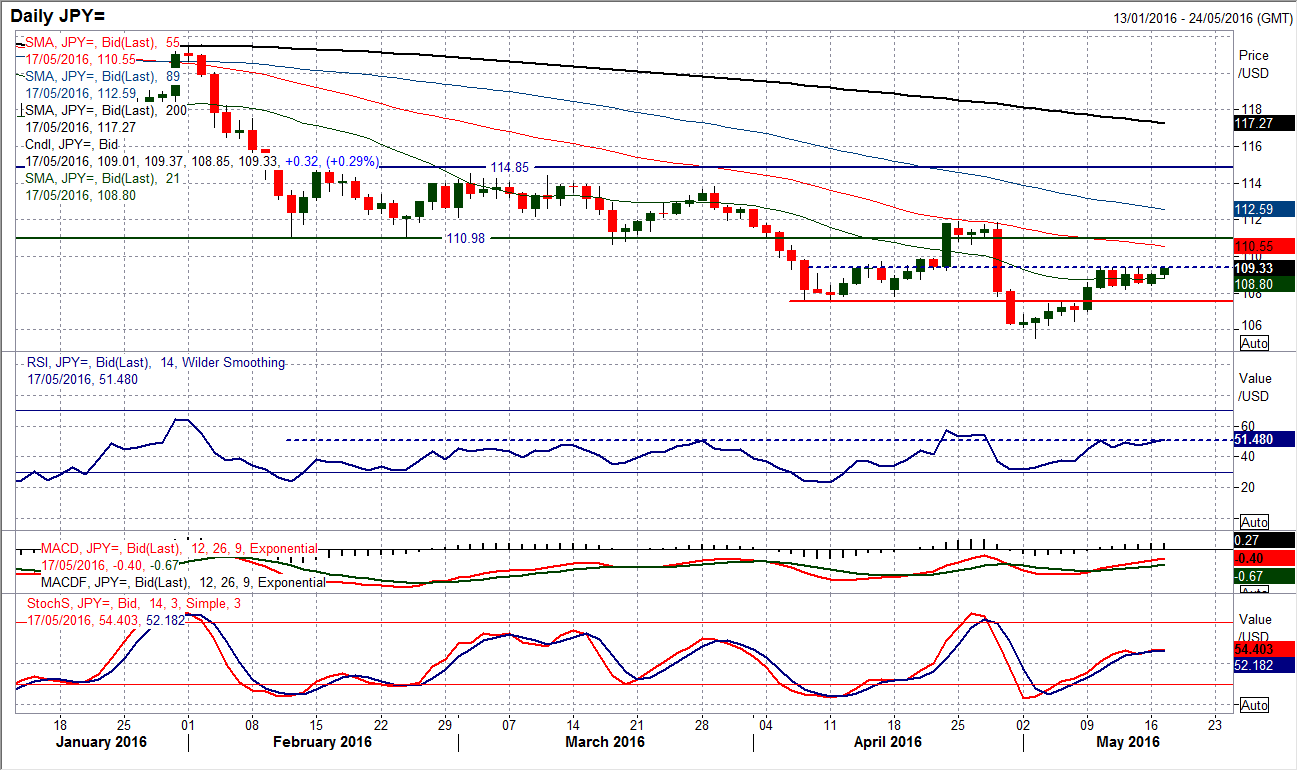
I could almost copy and paste in yesterday’s analysis for Dollar/Yen because very little has changed in the outlook. The sequence of bull and then bear candles has now got five completed candles in this consolidation and still we are little closer to a breakout. The support at 108.20 and resistance at 109.50 remains firmly in place. The momentum indicators are still almost entirely neutral with the RSI and Stochastics flat around 50 and the MACD lines drifting. The hourly chart shows that there is the slightest of positive biases to the outlook but the price movement has become incredibly benign in the last couple of days. A close above 109.50 or below 108.20 would constitute a breakout and signal a target of 130 pips projected in the direction of the break. For now though we await the catalyst.
Gold
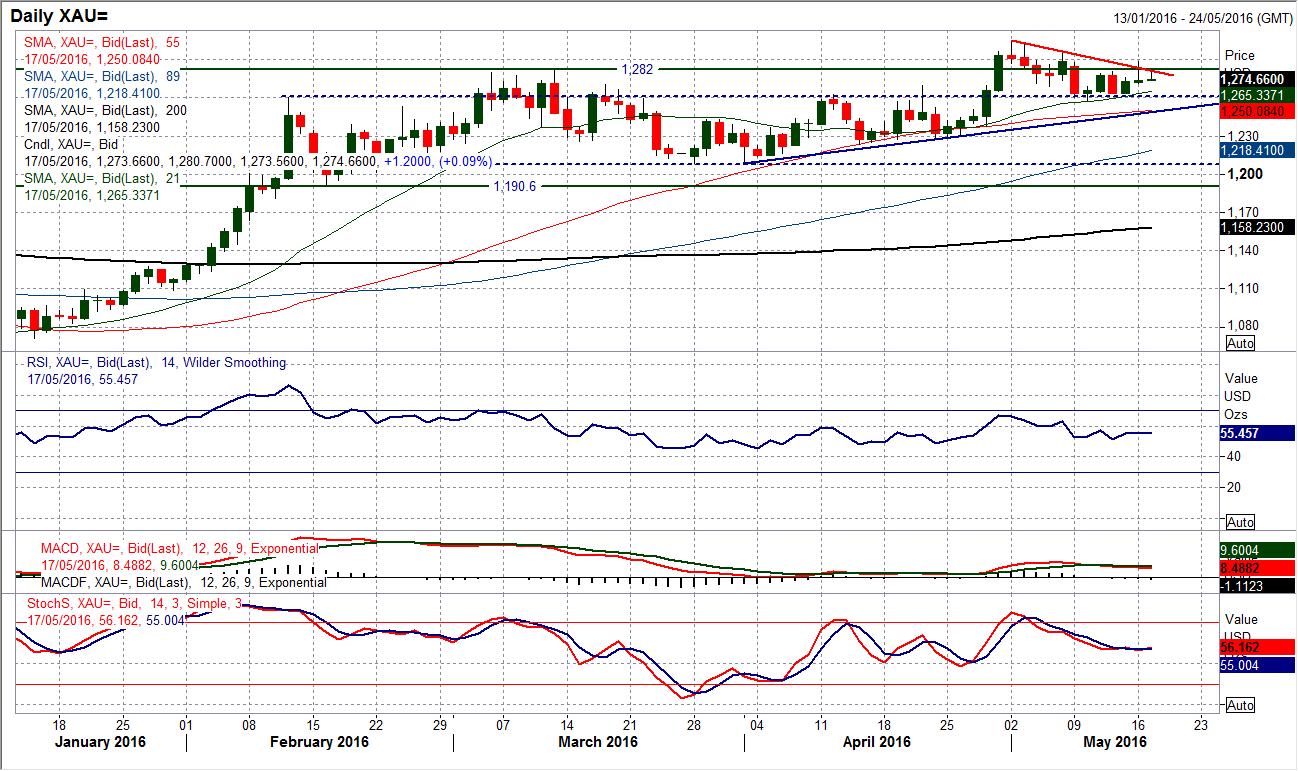
The bulls looked as though they were ready to regain control yesterday only for an intraday correction to take the power out of the candle. This has left a somewhat weak positive candle where the bull control is questionable. However there has been a degree of control once more but there is still much to be done for the bulls to feel comfortable. A closing breakout above $1282.50 (the old key resistance) would be significant an would open the resistance at $1295.70 and the key high at $1303.60. The momentum indicators are still set up to suggest that the bulls are ready to move into the ascendancy once more with the Stochastics having unwound nicely to now show signs of picking up again and the RSI well supported above 50.Yesterday’s high at $1288.20 is initial resistance. It is interesting that yesterday’s reaction low of $1270.90 was again around an old pivot level. The support around the old resistance at $1260 has been bolstered by the price action of the past week, with the reaction low at $1257.25 key.
WTI Oil
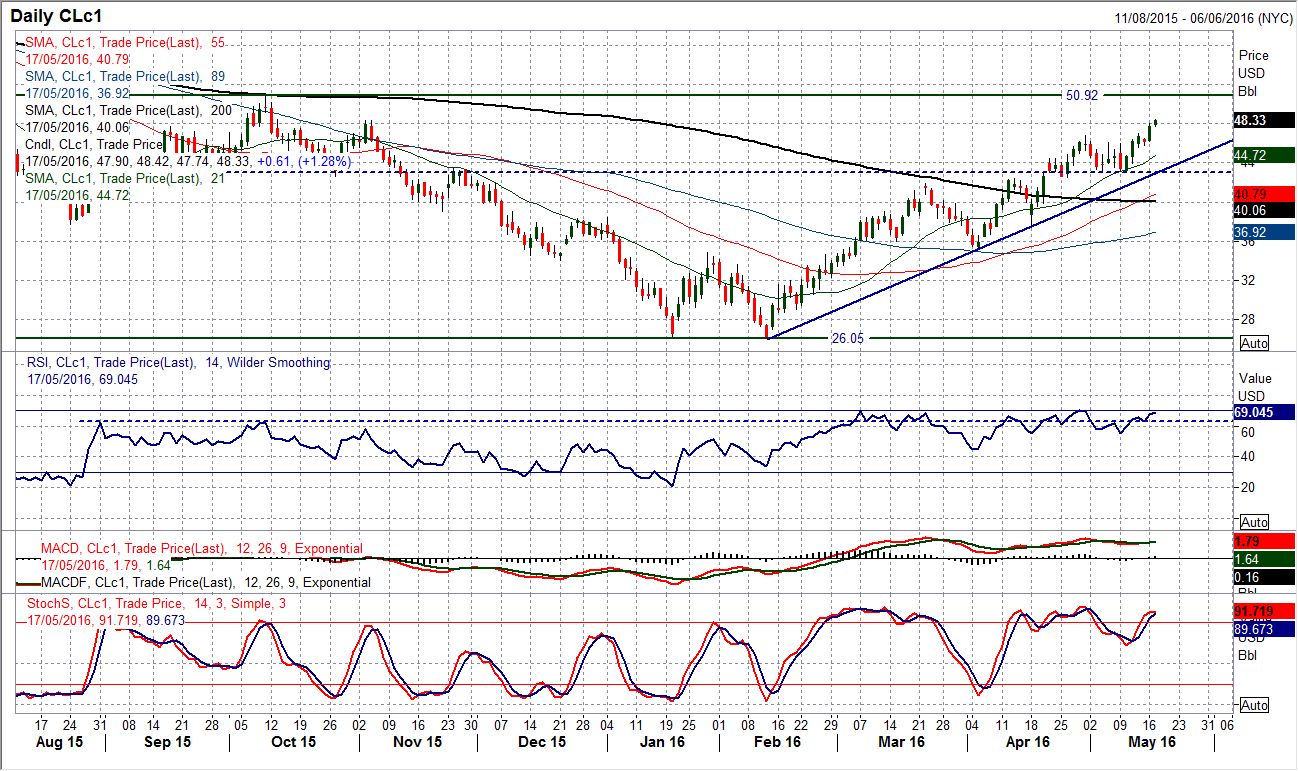
The bulls have made another upside breakout buoyed by the news that Goldman Sachs see the oil market fundamentals coming into balance sooner than expected. The price has subsequently confirmed the breakout above $46.80 and is now well on the way towards a test of the next key high from November at $48.35. The momentum indicators retain a bullish configuration but the RSI also has further upside potential , with recent moves in March and April pushing towards 70 (currently 68). The intraday hourly chart shows there is now a band of support between $45.60for the bulls to continue to build from and corrections will be seen as a chance to buy. The way is increasingly open for a full retracement back to the October key high at $50.92. Key medium term support is now at $43.00, today coinciding with the three month uptrend.
Note: All information on this page is subject to change. The use of this website constitutes acceptance of our user agreement. Please read our privacy policy and legal disclaimer. Opinions expressed at FXstreet.com are those of the individual authors and do not necessarily represent the opinion of FXstreet.com or its management. Risk Disclosure: Trading foreign exchange on margin carries a high level of risk, and may not be suitable for all investors. The high degree of leverage can work against you as well as for you. Before deciding to invest in foreign exchange you should carefully consider your investment objectives, level of experience, and risk appetite. The possibility exists that you could sustain a loss of some or all of your initial investment and therefore you should not invest money that you cannot afford to lose. You should be aware of all the risks associated with foreign exchange trading, and seek advice from an independent financial advisor if you have any doubts.
Recommended Content
Editors’ Picks
EUR/USD clings to gains above 1.0750 after US data

EUR/USD manages to hold in positive territory above 1.0750 despite retreating from the fresh multi-week high it set above 1.0800 earlier in the day. The US Dollar struggles to find demand following the weaker-than-expected NFP data.
GBP/USD declines below 1.2550 following NFP-inspired upsurge

GBP/USD struggles to preserve its bullish momentum and trades below 1.2550 in the American session. Earlier in the day, the disappointing April jobs report from the US triggered a USD selloff and allowed the pair to reach multi-week highs above 1.2600.
Gold struggles to hold above $2,300 despite falling US yields

Gold stays on the back foot below $2,300 in the American session on Friday. The benchmark 10-year US Treasury bond yield stays in negative territory below 4.6% after weak US data but the improving risk mood doesn't allow XAU/USD to gain traction.
Bitcoin Weekly Forecast: Should you buy BTC here? Premium

Bitcoin (BTC) price shows signs of a potential reversal but lacks confirmation, which has divided the investor community into two – those who are buying the dips and those who are expecting a further correction.
Week ahead – BoE and RBA decisions headline a calm week

Bank of England meets on Thursday, unlikely to signal rate cuts. Reserve Bank of Australia could maintain a higher-for-longer stance. Elsewhere, Bank of Japan releases summary of opinions.
