Market Overview
Although there is a consolidation that continues amongst forex major pairs, there is more of a positive mind-set this morning as a new week begins. The glass seems to be half full for a change. Traders return to their desks ready to move on the fact that the prospects of the third Greek bailout package are progressing well. Eurozone parliaments will be voting this week and for now there is little suggestion that this will not go through relatively smoothly (even in Germany). US markets were positive into the close on Friday amid the news, with the S&P 500 up 0.4%. Asian markets were supported this morning as Japanese Q2 GDP came in ahead of estimates. Consensus had expected -0.5% for the quarter but got -0.4%, which was able to support Japanese equities (Nikkei up 0.5%). European markets have made a decent bounce in early trading.
In forex markets it is more sedate with little real movement as we move into the European session, although with slightly positive moves for sterling and the Kiwi, the mood seems to be reasonably positive. Gold and silver are marginally higher in early trading, with the dollar under a little corrective pressure today.
There is little economic data due today with the NAHB Housing Market Index at 1500BST which is expected to pick up slightly to 61 from 60 last month.
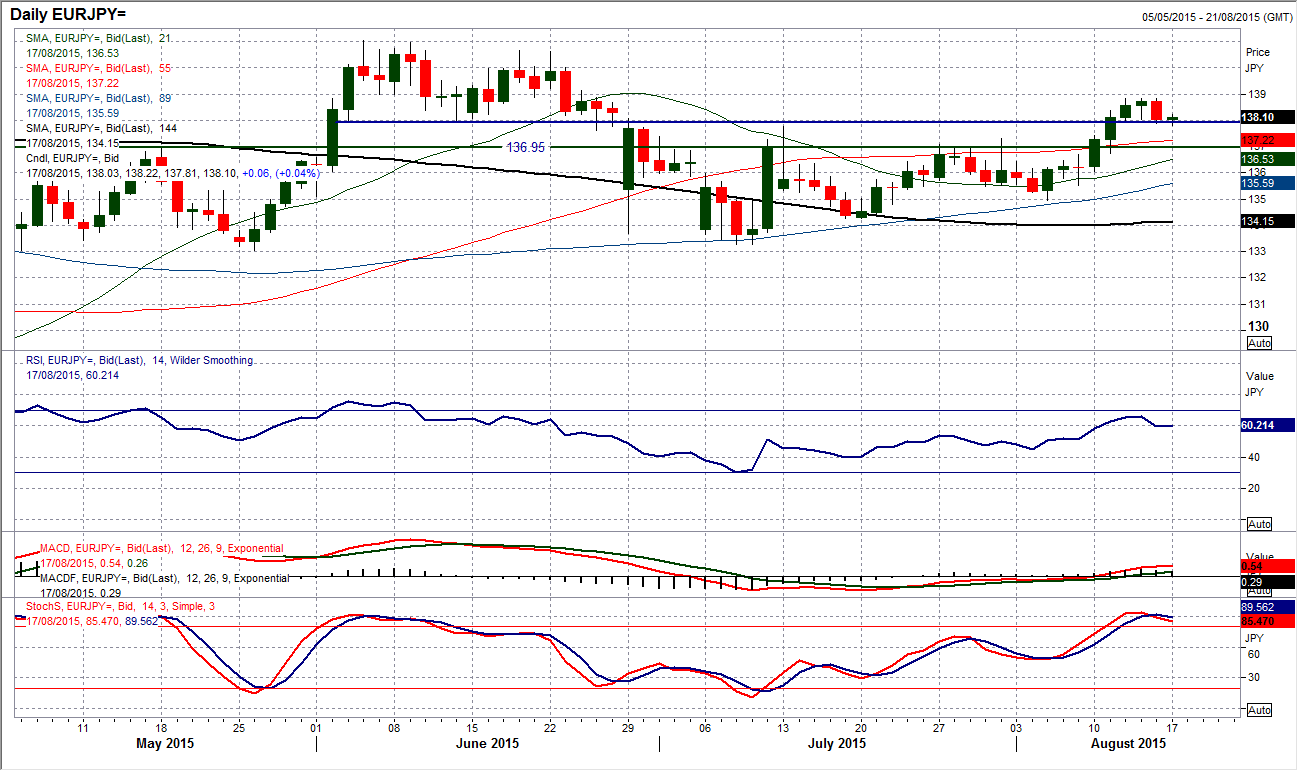
Chart of the Day – EUR/JPY
The rally that set in for early August has shown signs of running out of steam near term. The move through the resistance at 137.00 with a closing break was a strong move which suggests that there is strength behind the euro trading now. A minor setback for the bulls set in on Friday which is now questioning the continuation of the move. A strong bear candle was the first in almost two weeks and the Stochastics have crossed lower. However 138.00 has been previously support in June and if this breaks then a small top pattern wold be achieved as shown on the hourly chart. That would then imply a move back towards 137.20. This would be merely back towards the 137.00 old breakout resistance which will now be supportive. This should all not be of a great surprise as the past five weeks have been characterised by a consistent run higher truncated by minor corrections which find support at higher levels. The rising 89 day moving average (at 135.60) has taken on the role of the key near term basis of support.
EUR/USD
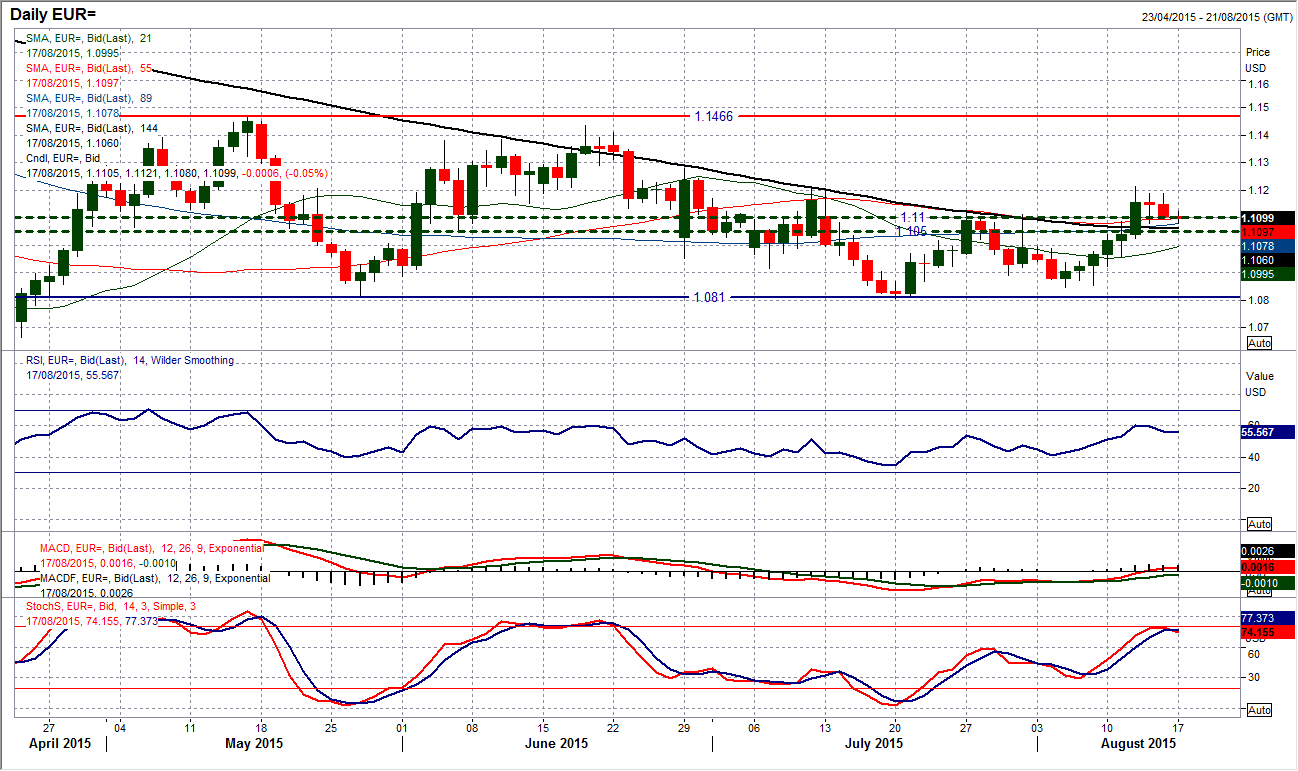
The euro is in a difficult phase of analysis. Is this a consolidation before further gains (possible flag pattern perhaps), or have the bears regained control to push the euro back lower again? I will be being two factors in my decision making. Firstly what I see now as a pivot band between $1.1050/$1.1100. Previously I have talked about $1.1050 being a pivot level but there have been so many turning points within the 50 pip band up to $1.1100 that I see this as more relevant now. There is also the 144 day moving average 9at $1.1060) which has previously acted as resistance and is now supportive. A close below both these and I will need to turn more negative again. The momentum indicators have tailed off their recovery, but for now $1.1080 has been used as support in the past few days. The intraday hourly chart shows a slightly corrective move is in process with the hourly momentum indicators falling away. The resistance comes in at $1.1188 and $1.1215 is key. A move below $1.1020 would confirm the bear control now.
GBP/USD
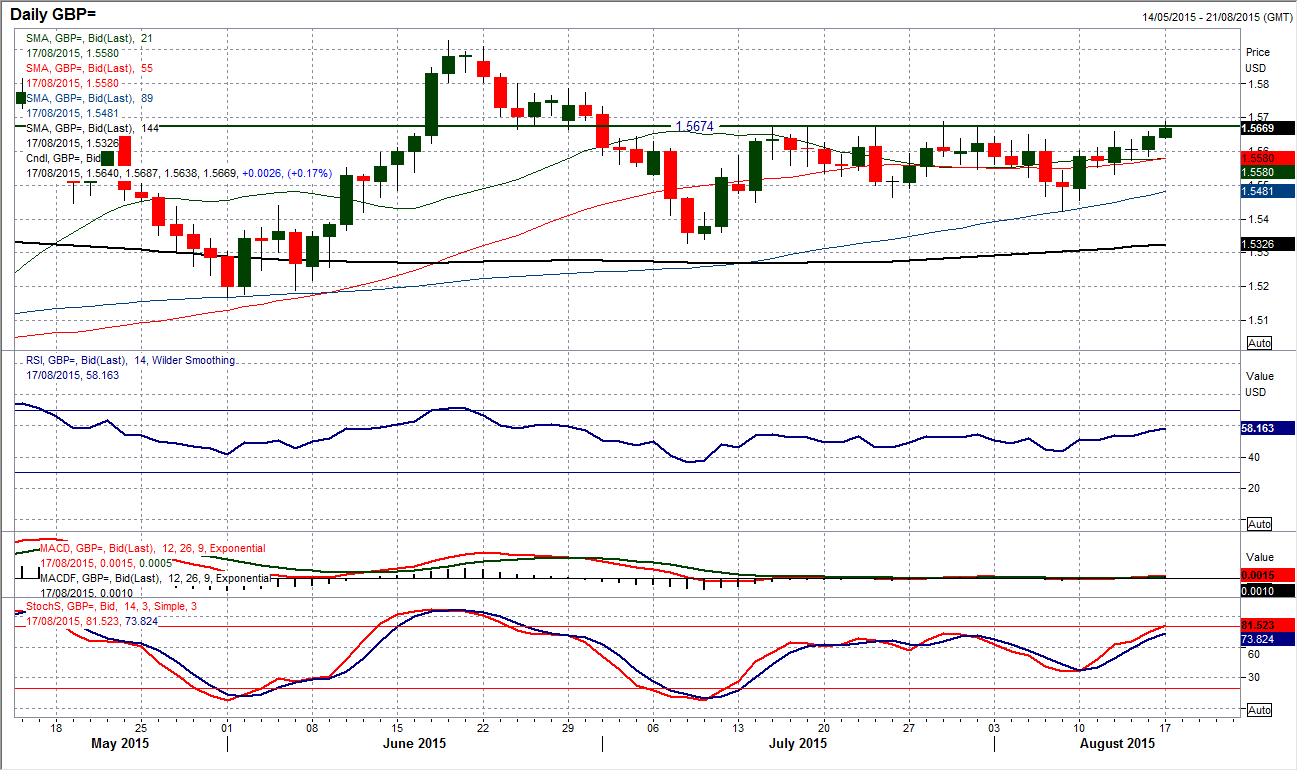
On at least five occasions in the past five weeks there has been an intraday move up towards $1.15670 which has failed and the price has drifted away again. It could be argued that the Sterling bulls have bounced back in a positive vein since the $1.5422 low was hit 7 sessions ago and now they are in a position once more to go for a breakout. Technical indicators have picked up slightly and are decent, if unspectacular. My feeling is that you have to play the range until a confirmed breakout is seen. That would be a close above the intraday peak at $1.5690. However, certainly an intraday move above $1.5700 would certainly pose big questions. The intraday hourly chart shows Cable trading around the 38.2% Fibonacci retracement level at $1.5645 again which historically has been a chance for short positions towards the 50% Fib level at $1.5558. The rather uninspiring hourly momentum indicators suggest this remains the stronger strategy still. Initial support is at $1.5600 and $1.5585.
USD/JPY
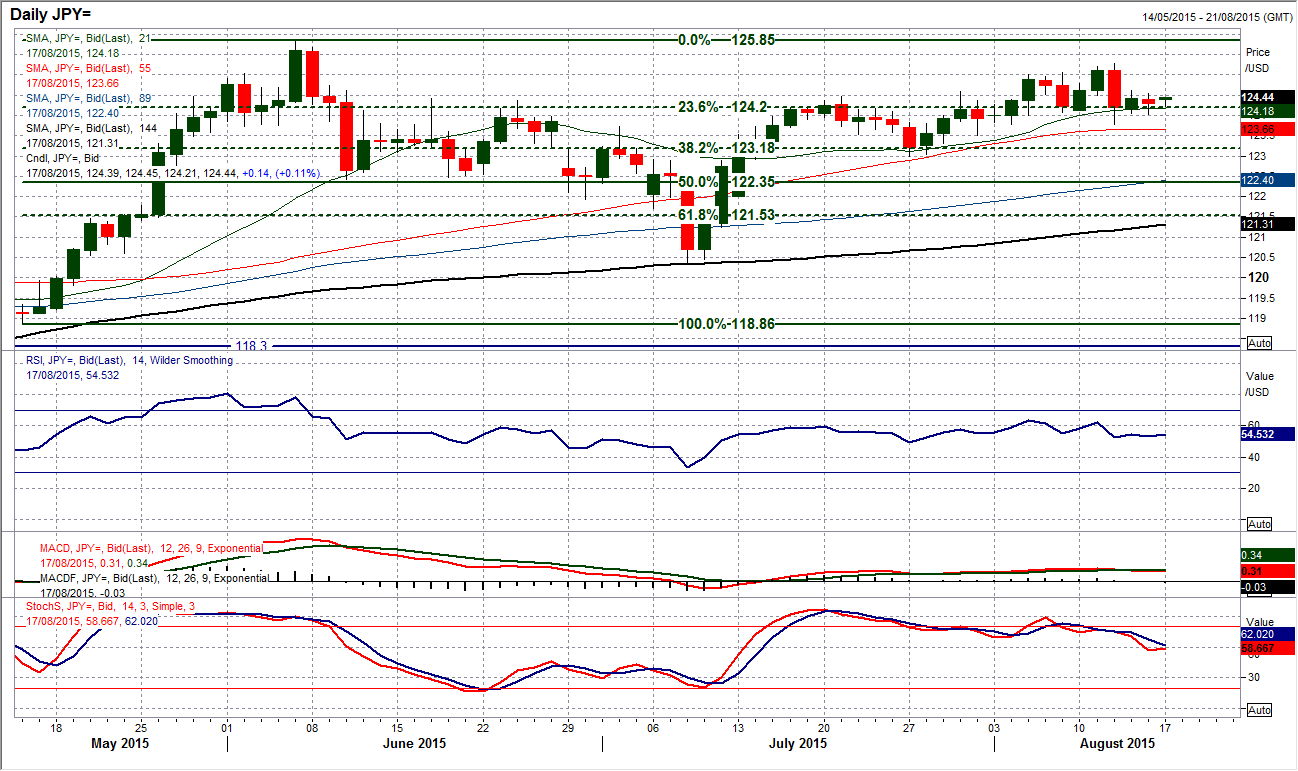
The mild strength of the yen that pulled the pair back down last week has entered into a mini consolidation. The outlook is far from certain with a variety of corrective signals still showing through that suggest a move back towards 123.00 could be seen. However there still needs to be a close below 124.00 support in order to trigger that move. I am still wary of the daily momentum indicators that have fallen away, but the 23.6% Fibonacci retracement is also still a big element of support at 124.20. The hourly chart shows that the near term resistance at 124.60 is building and a move above here today would just begin to give the bulls some traction again, whilst a move above the bearish key one day reversal/Bearish engulfing pattern high at 125.28 is the key resistance near term. This one is on a bit of a knife edge near term.
Gold
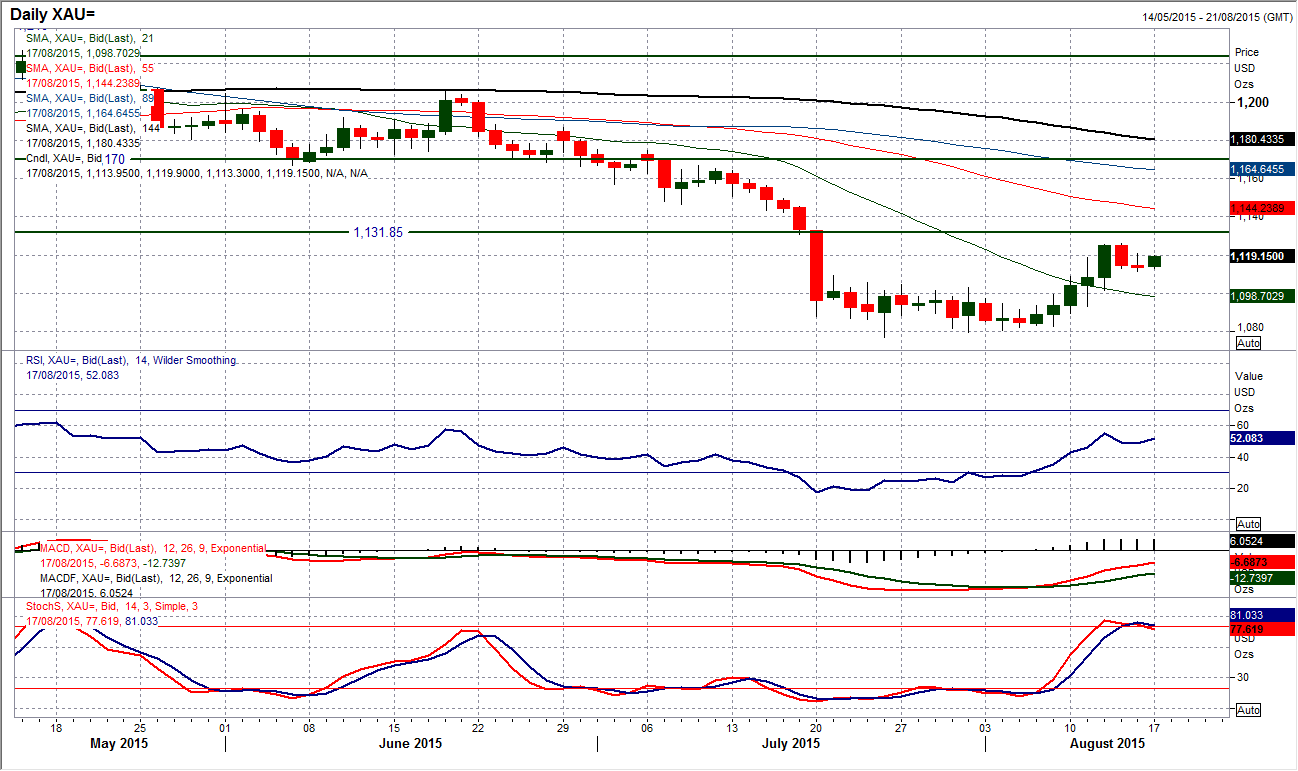
As with several of the major forex pairs, the chart of gold is again in a consolidation mode that means it is difficult to take a view with any real conviction. The technical signals are mixed, with momentum indicators stalling in their recovery but by no means have they started to deteriorate to the extent that the near term bulls have lost control. The consolidation is coming in and holding on to the support at $1111.40. This means that the near term rebound target of a move back to the resistance at $1131.85 should still not be ruled out. The support has come above the neckline of the small base pattern at $1105.60. The hourly momentum indicators have held on too with the RSI holding above 30 and MACD lines bottoming out too. This suggests that the selling pressure is not overpowering yet and a move back above Friday’s rebound high at $1121.00 would help build confidence again for the near term bulls.
WTI Oil
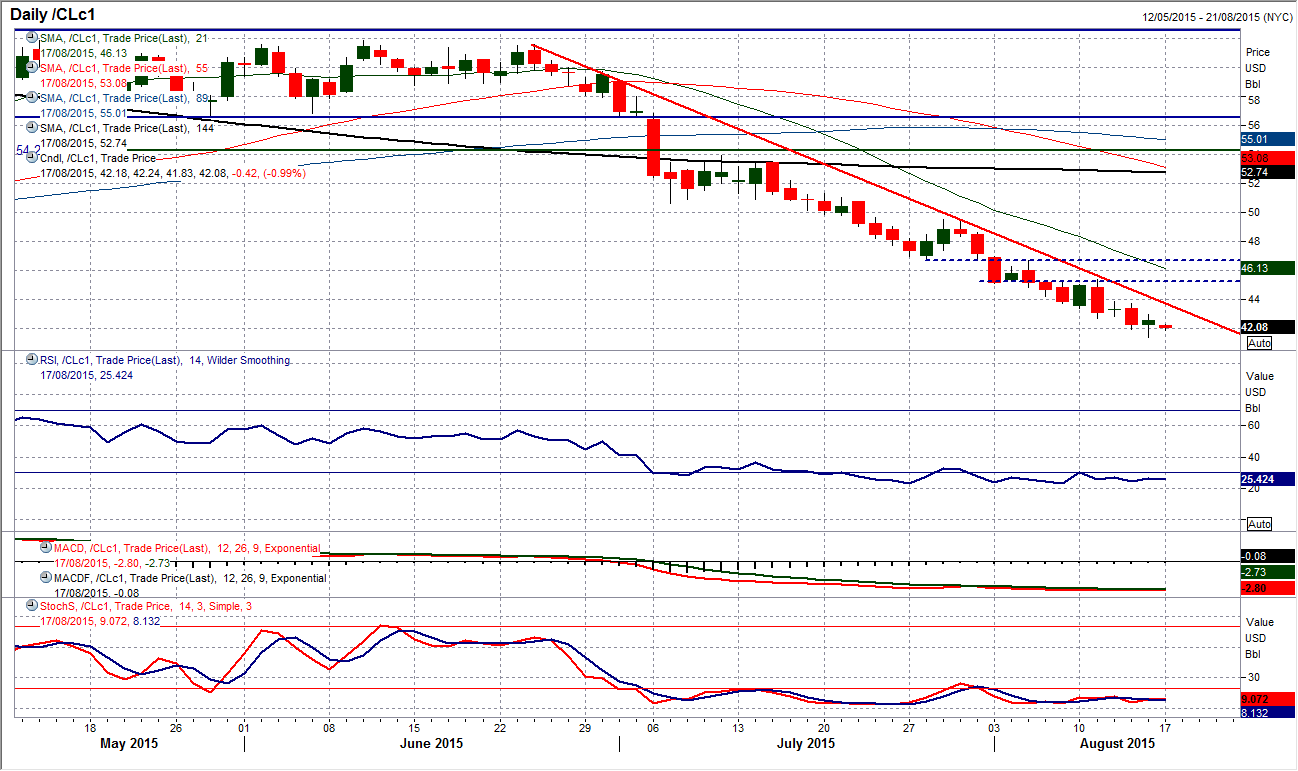
The positive trading sessions are just such a rare thing that whenever one pops up there is a feeling that this could finally be the support that has long been needed after a sell off of greater than 30% in 8 weeks. However, the truth is that until the downtrend is broken the “trend is your friend” and the bears are in control. The downtrend comes in today at $43.70. The momentum indicators continue to show no sign of any sustainable improvement and even the most minor of rallies are still seen as a chance to sell. Interestingly although there was a move to a new multi-year low at $41.35 on Thursday we are still yet to see a closing break of the March low at $42.03. The intraday hourly chart continues to show rallies are a chance to sell and that old support is new resistance with $42.70/$43.00 initially before resistance around $43.60 comes in to play. The next downside target is $40 but there is little to prevent a drop towards the December 2008/February 2009 support band $32.40/$33.50.
Note: All information on this page is subject to change. The use of this website constitutes acceptance of our user agreement. Please read our privacy policy and legal disclaimer. Opinions expressed at FXstreet.com are those of the individual authors and do not necessarily represent the opinion of FXstreet.com or its management. Risk Disclosure: Trading foreign exchange on margin carries a high level of risk, and may not be suitable for all investors. The high degree of leverage can work against you as well as for you. Before deciding to invest in foreign exchange you should carefully consider your investment objectives, level of experience, and risk appetite. The possibility exists that you could sustain a loss of some or all of your initial investment and therefore you should not invest money that you cannot afford to lose. You should be aware of all the risks associated with foreign exchange trading, and seek advice from an independent financial advisor if you have any doubts.
Recommended Content
Editors’ Picks
EUR/USD clings to gains above 1.0750 after US data

EUR/USD manages to hold in positive territory above 1.0750 despite retreating from the fresh multi-week high it set above 1.0800 earlier in the day. The US Dollar struggles to find demand following the weaker-than-expected NFP data.
GBP/USD declines below 1.2550 following NFP-inspired upsurge

GBP/USD struggles to preserve its bullish momentum and trades below 1.2550 in the American session. Earlier in the day, the disappointing April jobs report from the US triggered a USD selloff and allowed the pair to reach multi-week highs above 1.2600.
Gold struggles to hold above $2,300 despite falling US yields

Gold stays on the back foot below $2,300 in the American session on Friday. The benchmark 10-year US Treasury bond yield stays in negative territory below 4.6% after weak US data but the improving risk mood doesn't allow XAU/USD to gain traction.
Bitcoin Weekly Forecast: Should you buy BTC here? Premium

Bitcoin (BTC) price shows signs of a potential reversal but lacks confirmation, which has divided the investor community into two – those who are buying the dips and those who are expecting a further correction.
Week ahead – BoE and RBA decisions headline a calm week

Bank of England meets on Thursday, unlikely to signal rate cuts. Reserve Bank of Australia could maintain a higher-for-longer stance. Elsewhere, Bank of Japan releases summary of opinions.
