Market Overview
The significant sell-off on Wall Street yesterday does not bode well for risk appetite for the European session. The S&P 500 fell over 2%, while a 3.1% decline on the NASDAQ was its biggest one day decline since November 2011. The weakness permeated into Asia trading with indices in many of the markets lower while the Nikkei was another 2% lower. The move came as Chinese inflation came bang in line with estimates at 2.4%.
Forex trading early this morning has shown a degree of strength returning for the dollar, as the greenback has bounced against the Aussie and Kiwi dollars and perhaps more tellingly the Japanese yen. The strength of the yen has been a marked sign of the flight to safety that has been evident for investors in the past week and this strength could be a harbinger of support.
German CPI inflation came in line with expectations at 0.9%, in line with last month. Traders now will be looking towards the only really key economic release of the day with the University of Michigan sentiment at 14:55BST, expected to improve slightly to 81 from last month’s 80.
Chart of the Day – S&P 500
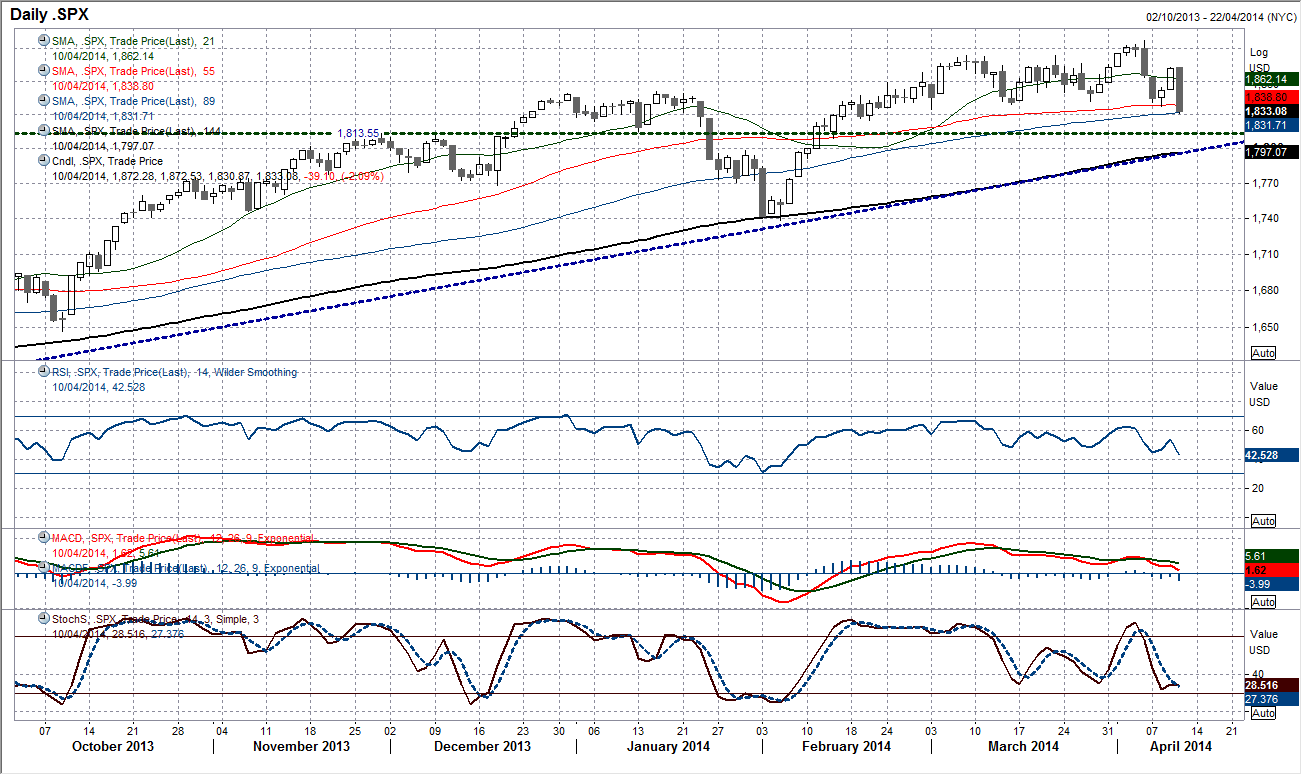
The strength of the bearish pressure seen in the past week has been reminiscent of the decline seen towards the end of January. With three long black candles in the past five sessions (very bearish one day candlestick patterns), the bottom of the trading band at 1834.44 has been broken and the S&P is trading at a 7 week low.
Despite this the longer term trends remain positive with the 144 day moving average the big basis of support at 1797 around also where the primary uptrend support comes in. The next real band of support comes in around 1812/1815. Despite the weakness over the past few days, the momentum indicators are now showing signs of too much stress and actually still look merely corrective. The moves over the past few days at the moment looks simply to be just another chance to buy once more for yet another retest of the all-time high at 1897.28.
EUR/USD
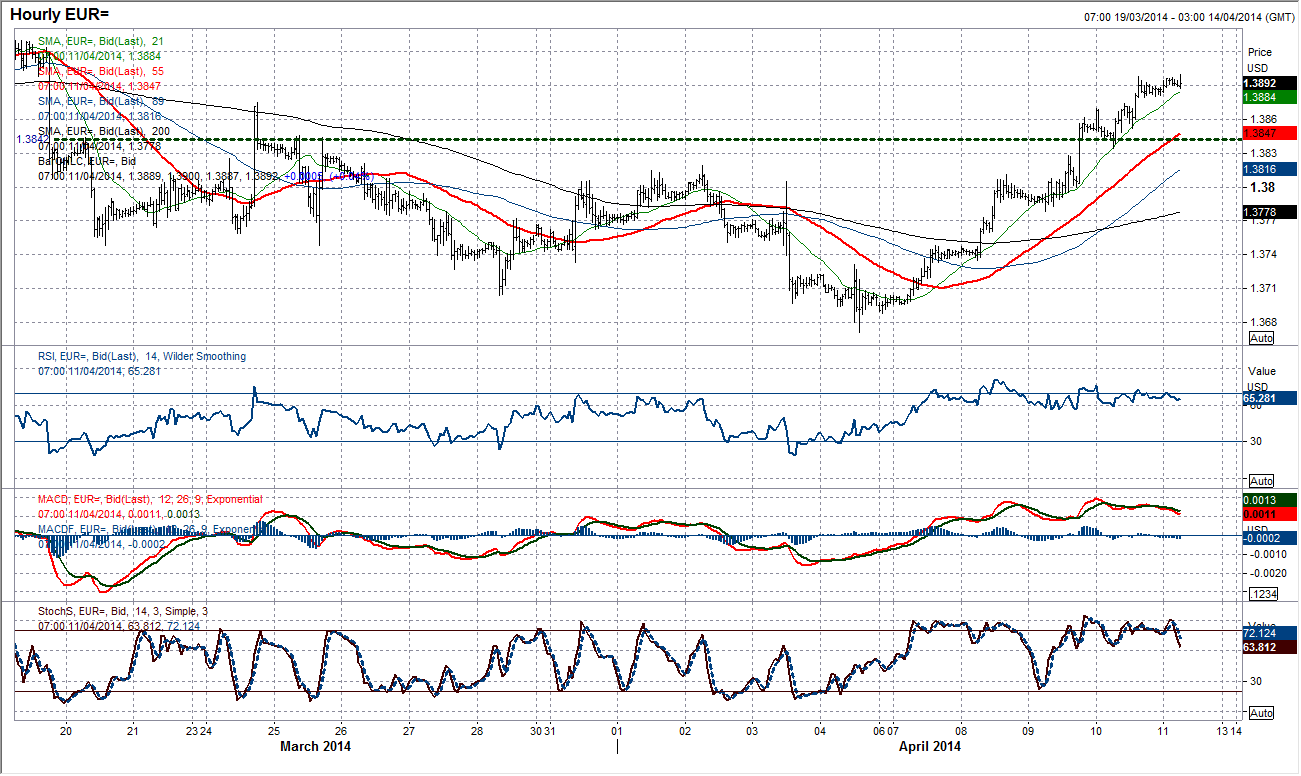
The Euro has remained strong as it continues to push higher, breaking resistance at $1.3875 on its way towards is next key test at $1.3947. The daily chart shows that after four straight days of gains, momentum is strong and there seems little technical reason now to suggest there will not be further gains made today. The intraday chart backs this outlook as well, as the hourly momentum indicators are all in strongly bullish configuration and the rate continues to use the riing 21 hour moving average as the basis of support. With a series of bullish flags and falling wedge patterns over the past week, the latest consolidation overnight can be expected to resolve to the upside once more. There is now a good band of support between $1.3800 and $1.3850 to hold a correction and the bullish phase would only really be considered over if the support back at $1.3778 breaks.
GBP/USD
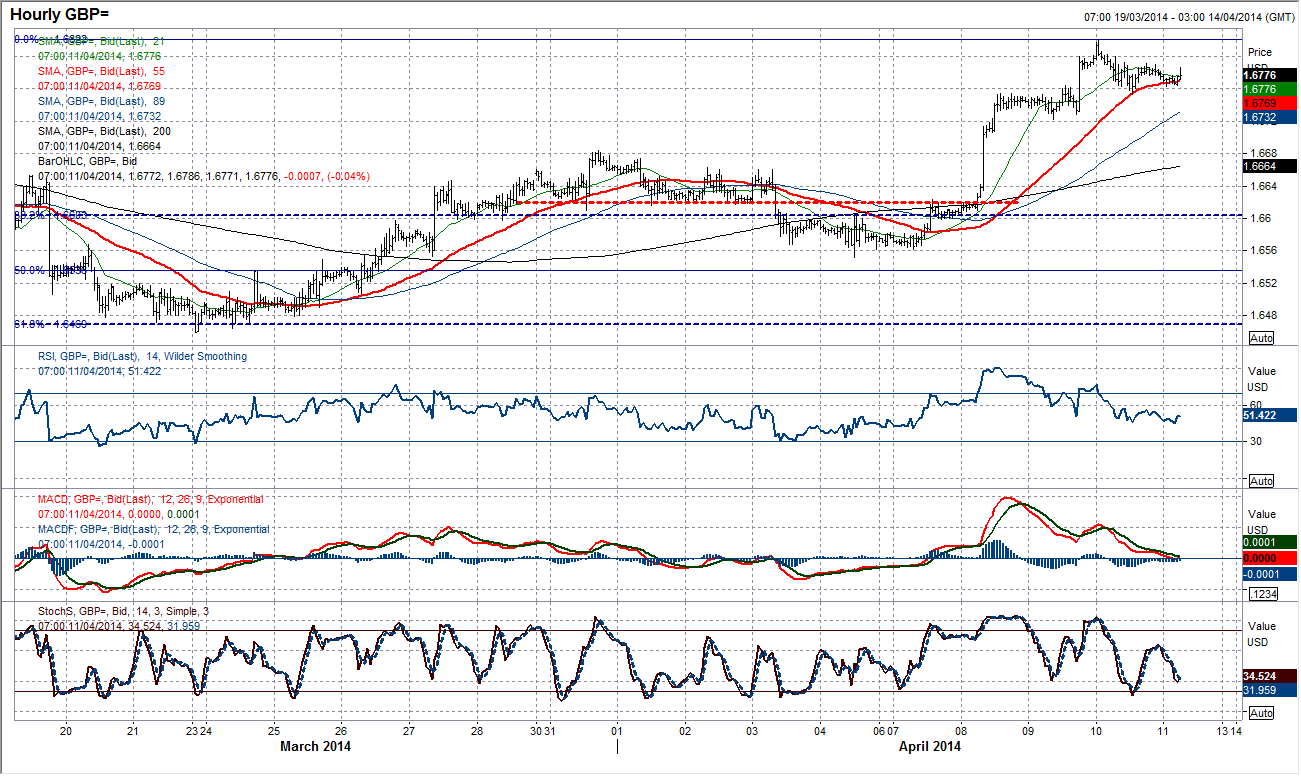
Sterling has been unable to replicate the strength of the Euro against the Dollar in the last couple of days as the strong gains earlier in the week have been consolidated. The failure to breach the key high at $1.6822 seems to be weighing on sentiment which is drifting off once more. The daily momentum indicators, despite being in positive configuration, are beginning to reflect this consolidation and are beginning to roll over. The risk is that this phase could still turn out to be a bull pattern which would be the case if there were to be a breach of the $1.6822 resistance. However, the shorter intraday hourly moving averages have caught up and the hourly momentum indicators have already unwound. So if this is just a bull consolidation then there will need to be a pick up, probably today, otherwise the bulls could get tired. Therefore the support band $1.6729/$1.6754 is key near term. A breach would open a move back towards the old breakout high at $1.6684.
USD/JPY
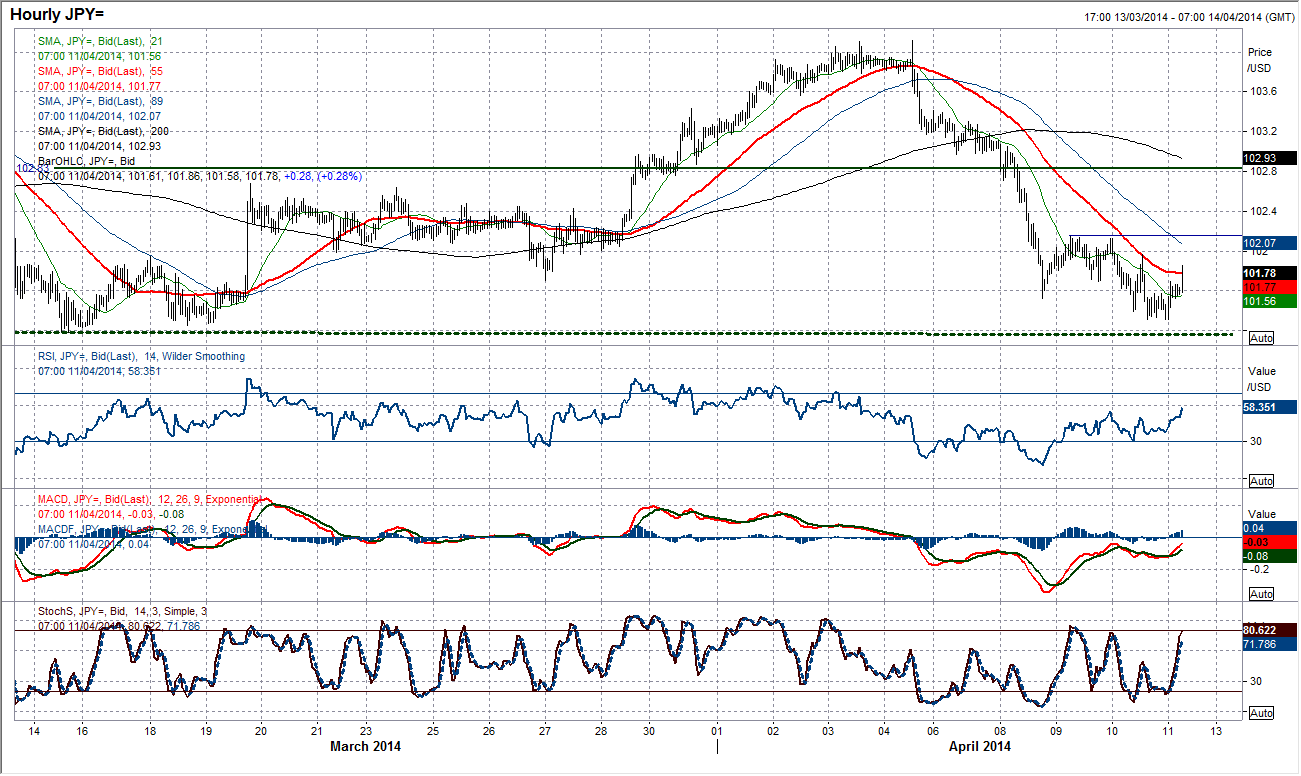
The bullish long term outlook is under considerable strain. The support of the rising 144 day moving average is being severely tested and the bottom of a 10 week trading channel is also under threat. Despite this though, the daily momentum indicators still do not suggest an impending breakdown and maintain a configuration consistent with the bottom of a trading range. The intraday hourly chart shows consistent decline over the past week, however possible signs that the momentum is losing downside impetus. The lower lows of yesterday were not replicated on RSI, MACD or Stochastics, with the MACD lines taking on a head and shoulders reversal configuration. Watch out for the falling 55 hour moving average (currently 101.77) potentially being breached to the upside, Dollar/Yen has not traded above it all week. A move above the reaction high at 101.97 would be a confirmation signal for a recovery.The lows have come in at 101.31 overnight and a breakdown would clearly harm the potential for a recovery. The key low on the daily chart remains 101.17.
Gold
The recovery currently being built by gold is very encouraging. Daily technical indicators are increasingly backing the recovery, with the Stochastics advancing strongly, RSI back above 50 and a crossover buy signal on the MACD lines. A move back above the 21 day moving average is also encouraging. The price has now completed 7 consecutive days of higher lows and appears to be on course for a test of the reaction high at $1342.43. The hourly intraday chart shows the formation of a strong uptrend channel where the old breakout highs continue to be used as the basis of support for corrections. Currently this means that there is good support arriving around $1314.43, with the bottom of the channel coinciding with the support of the 89 hour moving average at $1310.30. The overnight consolidation has given the hourly momentum indicators the opportunity to unwind and any weakness should now be considered to be a chance to buy.
Note: All information on this page is subject to change. The use of this website constitutes acceptance of our user agreement. Please read our privacy policy and legal disclaimer. Opinions expressed at FXstreet.com are those of the individual authors and do not necessarily represent the opinion of FXstreet.com or its management. Risk Disclosure: Trading foreign exchange on margin carries a high level of risk, and may not be suitable for all investors. The high degree of leverage can work against you as well as for you. Before deciding to invest in foreign exchange you should carefully consider your investment objectives, level of experience, and risk appetite. The possibility exists that you could sustain a loss of some or all of your initial investment and therefore you should not invest money that you cannot afford to lose. You should be aware of all the risks associated with foreign exchange trading, and seek advice from an independent financial advisor if you have any doubts.
Recommended Content
Editors’ Picks
EUR/USD clings to gains above 1.0750 after US data

EUR/USD manages to hold in positive territory above 1.0750 despite retreating from the fresh multi-week high it set above 1.0800 earlier in the day. The US Dollar struggles to find demand following the weaker-than-expected NFP data.
GBP/USD declines below 1.2550 following NFP-inspired upsurge

GBP/USD struggles to preserve its bullish momentum and trades below 1.2550 in the American session. Earlier in the day, the disappointing April jobs report from the US triggered a USD selloff and allowed the pair to reach multi-week highs above 1.2600.
Gold struggles to hold above $2,300 despite falling US yields

Gold stays on the back foot below $2,300 in the American session on Friday. The benchmark 10-year US Treasury bond yield stays in negative territory below 4.6% after weak US data but the improving risk mood doesn't allow XAU/USD to gain traction.
Bitcoin Weekly Forecast: Should you buy BTC here? Premium

Bitcoin (BTC) price shows signs of a potential reversal but lacks confirmation, which has divided the investor community into two – those who are buying the dips and those who are expecting a further correction.
Week ahead – BoE and RBA decisions headline a calm week

Bank of England meets on Thursday, unlikely to signal rate cuts. Reserve Bank of Australia could maintain a higher-for-longer stance. Elsewhere, Bank of Japan releases summary of opinions.


