![]() LikesMoney
LikesMoney
Independent Analyst
The Dollar
The dollar formed a swing low on Friday which may signal an extended daily cycle low has formed.
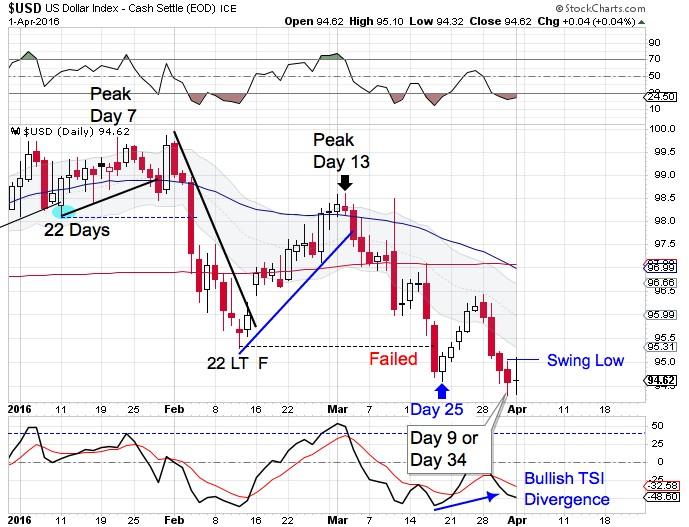
There are 2 reasons why I suspect an extended daily cycle.
1) The lower low has extended the intermediate cycle out to week 31. An extended daily cycle count becomes more likely than seeing the weekly cycle extend out by another 4 - 5 weeks.
2) The bullish TSI divergence indicates a possible bullish surprise.
The dollar will need to close above the lower daily cycle band to confirm that Friday was day 1 of a new daily cycle. And if Friday was day 1 of a new daily cycle, it will likely mark the beginning of a new intermediate cycle.
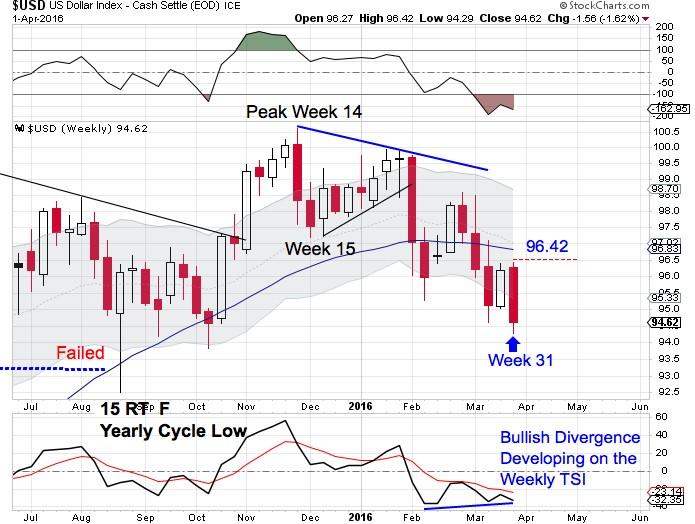
This was week 31 for the dollar's weekly cycle. This places the dollar is deep in its timing band to print an intermediate cycle low. A break above 96.42 forms a weekly swing low to signal a new intermediate cycle.
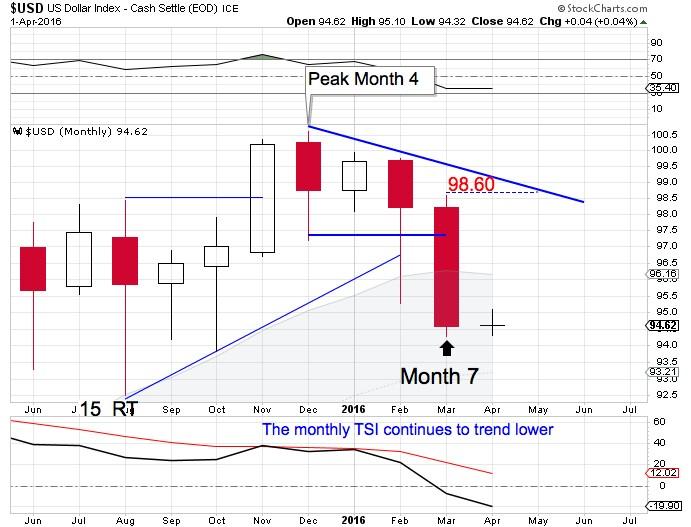
March was month 7 for the yearly dollar cycle, which places the dollar early in its timing band to form a yearly cycle low. A break above 98.60 forms a monthly swing low. Then a break above the declining monthly trend line will confirm that March hosted the yearly cycle low.
Since seven months is on the early side for a yearly cycle low, we will need to watch to see if the dollar is rejected by the declining monthly trend line to continue its yearly cycle decline.
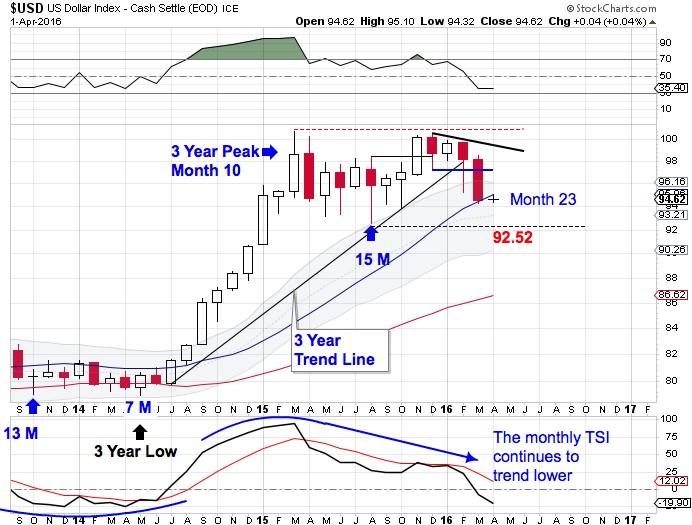
The 3 year cycle peaked back on month 10. April is month 23 for the 3 year dollar cycle. February’s break of the 3 year trend line indicates that the dollar has begun its 3 year cycle decline. A failed yearly cycle is required to complete the 3 year cycle decline. Currently a break below 92.52 will form a failed yearly cycle.
However if March hosted a yearly cycle low, that will ease the parameters for forming a failed yearly cycle. If a new yearly cycle is confirmed, by a break above the declining monthly trend line, then a break below March’s low 94.61 will form a failed yearly cycle. The dollar’s 3 year cycle averages about 36 months. So if March was the yearly cycle low, allowing 10 – 12 months would then bring the dollar to months 32 – 34, which is right in the timing band for a 3 year cycle low.
Stocks
Stocks have done a masterful job this week masking its intentions. But it looks more and more like stocks printed a stealth 29 day, daily cycle low.
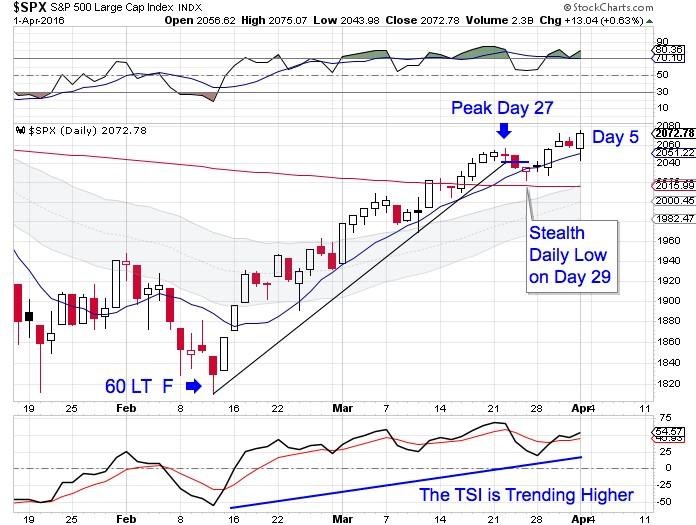
This week we discussed a possible stealth 29 day, daily cycle low. And then we also considered that the swing high that formed off of Wednesday may have signaled the daily cycle peak. But stocks breaking out to a new high on Friday has negated the swing high formed on Thursday. Which brings us back to a day 29 daily cycle low. Using our trend line tool we see that stocks peaked on day 27. Stocks formed a swing high on day 28 and broke below the daily cycle trend line to signal the daily cycle decline. Stocks then went on to print their lowest point on day 29. Aside from the shallow decline, that was a textbook example of a decline into a daily cycle low. Which makes Friday day 5 of a new daily cycle.
Stocks continue to close above the upper daily cycle band, indicating that stocks are in a daily uptrend. Stocks will remain in a daily uptrend until they close below the lower daily cycle band.
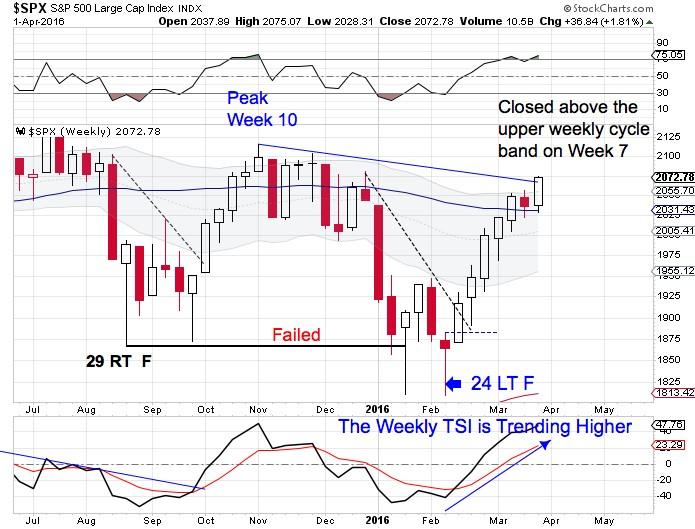
This was week 7 for the intermediate equity cycle. Stocks continue higher this week. Stocks closed above the upper weekly cycle band and broke above the declining weekly trend line indicating a new weekly uptrend and to signal that February hosted the yearly cycle low.
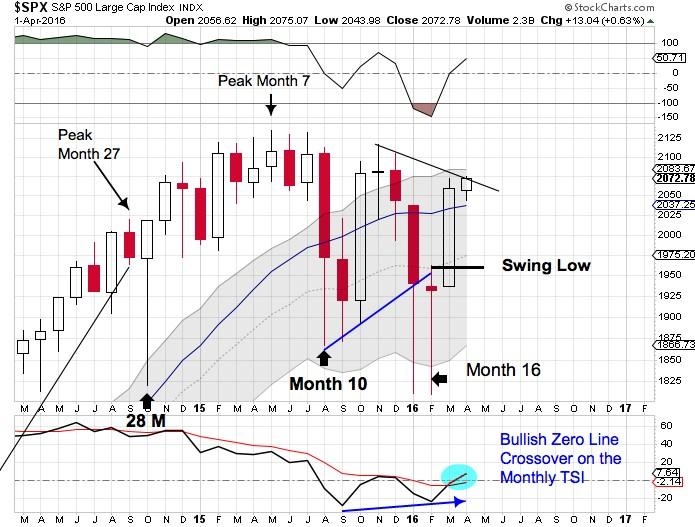
Stocks have been in a monthly uptrend through July that was characterized by closing above the upper monthly cycle band. Stocks managed to close above the lower monthly cycle band during their decline into its yearly cycle low. Therefore stocks remain in a monthly uptrend. A monthly close above the upper monthly cycle band will reestablish the monthly uptrend.
Note: All information on this page is subject to change. The use of this website constitutes acceptance of our user agreement. Please read our privacy policy and legal disclaimer. Opinions expressed at FXstreet.com are those of the individual authors and do not necessarily represent the opinion of FXstreet.com or its management. Risk Disclosure: Trading foreign exchange on margin carries a high level of risk, and may not be suitable for all investors. The high degree of leverage can work against you as well as for you. Before deciding to invest in foreign exchange you should carefully consider your investment objectives, level of experience, and risk appetite. The possibility exists that you could sustain a loss of some or all of your initial investment and therefore you should not invest money that you cannot afford to lose. You should be aware of all the risks associated with foreign exchange trading, and seek advice from an independent financial advisor if you have any doubts.
Recommended Content
Editors’ Picks
EUR/USD clings to gains above 1.0750 after US data

EUR/USD manages to hold in positive territory above 1.0750 despite retreating from the fresh multi-week high it set above 1.0800 earlier in the day. The US Dollar struggles to find demand following the weaker-than-expected NFP data.
GBP/USD declines below 1.2550 following NFP-inspired upsurge

GBP/USD struggles to preserve its bullish momentum and trades below 1.2550 in the American session. Earlier in the day, the disappointing April jobs report from the US triggered a USD selloff and allowed the pair to reach multi-week highs above 1.2600.
Gold struggles to hold above $2,300 despite falling US yields

Gold stays on the back foot below $2,300 in the American session on Friday. The benchmark 10-year US Treasury bond yield stays in negative territory below 4.6% after weak US data but the improving risk mood doesn't allow XAU/USD to gain traction.
Bitcoin Weekly Forecast: Should you buy BTC here? Premium

Bitcoin (BTC) price shows signs of a potential reversal but lacks confirmation, which has divided the investor community into two – those who are buying the dips and those who are expecting a further correction.
Week ahead – BoE and RBA decisions headline a calm week

Bank of England meets on Thursday, unlikely to signal rate cuts. Reserve Bank of Australia could maintain a higher-for-longer stance. Elsewhere, Bank of Japan releases summary of opinions.