EUR/USD Current Price: 1.1342
View Live Chart for the EUR/USD
The American dollar edged lower this Thursday, as following the vague statement of the US Federal Reserve, the Bank of Japan decided to stay path, with Kuroda saying they need more time to assess the effects of negative rates. The EUR/USD pair, despite reaching a fresh weekly high of 1.1367, was unable to benefit much, as data coming from both shores of the Atlantic, resulted mixed. In Germany, unemployment fell by 16,000 and wages grew during April, but harmonized inflation fell into negative territory, down 0.3% monthly basis, and by 0.1% compared to a year before.
US data was also mixed as the advanced GDP for Q1 showed the economy grew at an annualized rate of 0.5% against the 0.7% expected, the slowest pace in two years, underlying the slowdown suffered by the US economy since the last quarter of 2015. Core CPE on the other hand, jumped to 2.1% during the quarter, which could heighten expectations that the Fed could act sooner than expected, particularly if the economy gives some signs of further recovery.
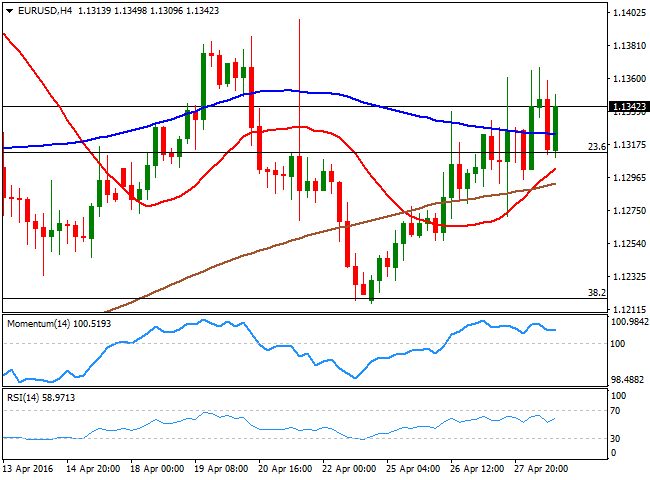
Having advanced for a fourth consecutive day, the EUR/USD pair has broken above the 1.1315 Fibonacci level early Asia, and retracements towards the level during the next sessions attracted buying interest. Nevertheless, the 4 hours chart presents a neutral-to-bullish stance, as the technical indicators head nowhere within positive territory, but the price is above its moving averages, with the 20 SMA heading north around 1.1310. The pair has still to beat the strong resistance in the 1.1380/90 region to be able to advance further, eyeing then a retest of the 1.1460 price zone, a major long term resistance level.
Support levels: 1.1315 1.1270 1.1230
Resistance levels: 1.1385 1.1420 1.1460
EUR/JPY Current price: 122.54
View Live Chart for the EUR/JPY
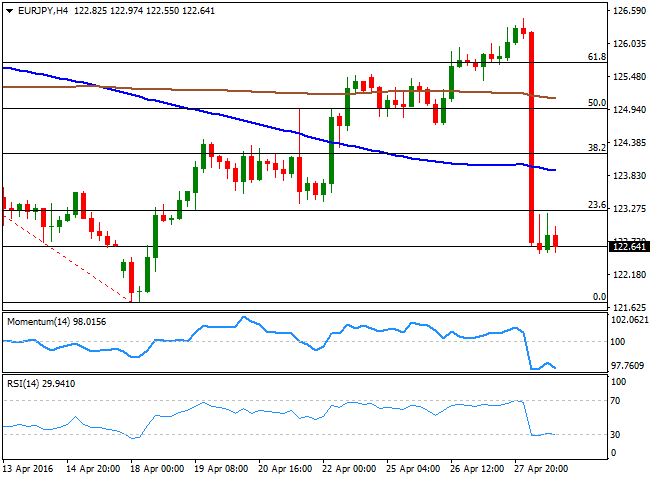
The EUR/JPY pair plummeted nearly 400 pips after the Bank of Japan decided to leave its economic policy unchanged. Despite earlier on the week there were some rumors making the rounds that the BOJ was not going to act this time, the market was expecting the Central Bank to react firmly to recent JPY's strength, having already priced in last week some kind of extension in the ongoing monetary stimulus. Demand for the JPY skyrocketed after the announcement, and the currency spent most of the last two sessions consolidating its newly acquired gains. Short term, the 1 hour chart shows that the technical indicators have corrected extreme oversold readings before turning back south, whilst the price remains near the daily low set at 122.52, supporting some additional declines for the upcoming hours. In the 4 hours chart, the technical indicators have also turned south after a limited upward corrective movement from extreme levels, in line with the shorter term outlook and supporting a retest of April low of 121.70.
Support levels: 122.50 122.10 121.70
Resistance levels: 123.35 123.70 124.20
GBP/USD Current price: 1.4611
View Live Chart for the GBP/USD
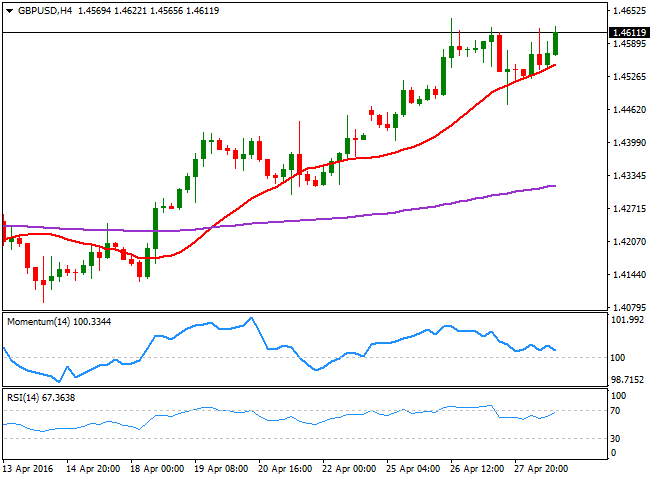
The GBP/USD pair consolidates in the upper end of its recent range, advancing modestly above the 1.4600 level by the end of the day on broad dollar's weakness. The pair has lost upward traction after reaching 1.4637 earlier this week, but there are no technical signs suggesting the greenback may reverse its recent losses against the Pound, furthermore, as Brexit fears have continued to decrease. From a technical point of view, and according to the 4 hours chart, the pair can keep rallying on a break above the mentioned weekly high, given that approaches to a bullish 20 SMA, currently around 1.4550, have steadily attracted buying interest, indicating speculative interest is waiting for dips. In the same chart, the RSI indicator heads north around 67, supporting the upward bias, but the momentum indicator presents some limited bearish divergences, yet to be confirmed, by posting lower highs within positive territory.
Support levels: 1.4590 1.4550 1.4510
Resistance levels: 1.4640 1.4685 1.4720
USD/JPY Current price: 108.13
View Live Chart for the USD/JPY
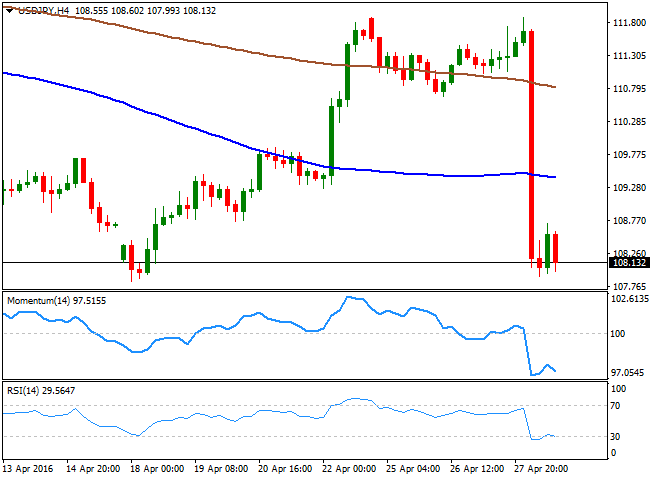
The USD/JPY pair plummeted to 107.91, its lowest since April 18th, after the Bank of Japan said, in its monthly meeting, that it needs more time to assess the impact of negative interest rates, and decided to maintain its monetary policy unchanged. The announcement caught investors wrong-footed, as over the past three weeks, they have been steadily pricing in some action from the BOJ. The JPY came back with a vengeance, and the USD/JPY pair is poised to extend its decline, particularly on a break below the 107.60 region, where it established a triple floor late March/early April. Intraday technical readings support such decline, given that in the 1 hour chart, the technical indicators have corrected extreme oversold readings, but the Momentum indicator remains below its 100 level, whilst the RSI indicator consolidates around 26. In the 4 hours chart, the technical indicators have resumed their declines after a limited upward corrective move, also indicating that further slides are likely for this Friday.
Support levels: 107.60 107.20 106.80
Resistance levels: 108.35 108.70 109.10
AUD/USD Current price: 0.7574
View Live Chart for the AUD/USD
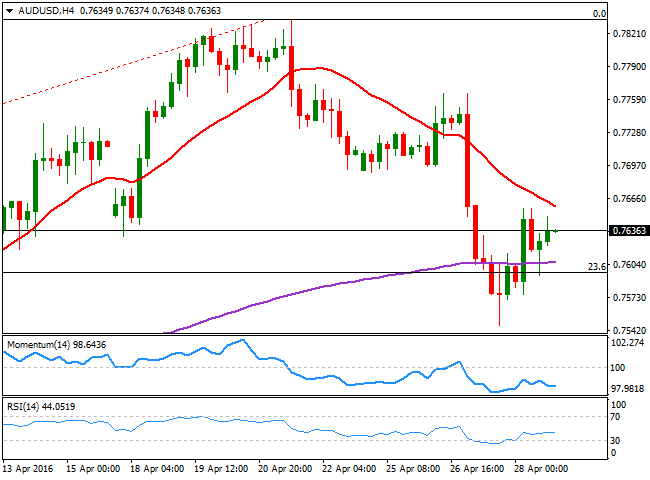
The AUD/USD pair recouped some ground this Thursday, bouncing from the 0.7600 region up to 0.7657, before settling midway. Data coming from Australia earlier in the day showed that Q1 terms of trade were soft with export prices down by 4.7% in the three firsts months of the year, and import prices falling 3.0%, both skewed by falling oil prices. Nevertheless, broad dollar's weakness prevailed and the pair Aussie advanced, also finding support in stronger commodities' prices. Technically the pair has recovered after a brief decline below the 23.6% retracement of this year's rally at 0.7600, which suggests that the bullish momentum made have faded, but it's far from reversing. In the 4 hours chart, the outlook is still negative, as the price develops below a bearish 20 SMA, currently around 0.7660, whilst the technical indicators have lost upward strength after bouncing from oversold readings, and are now flat well below their mid-lines. A steeper recovery above the mentioned 0.7660 region should favor a continued advance, up to the 0.7740/50 price zone for this Friday.
Support levels: 0.7600 0.7570 0.7540
Resistance levels: 0.7660 0.7700 0.7745
Information on these pages contains forward-looking statements that involve risks and uncertainties. Markets and instruments profiled on this page are for informational purposes only and should not in any way come across as a recommendation to buy or sell in these assets. You should do your own thorough research before making any investment decisions. FXStreet does not in any way guarantee that this information is free from mistakes, errors, or material misstatements. It also does not guarantee that this information is of a timely nature. Investing in Open Markets involves a great deal of risk, including the loss of all or a portion of your investment, as well as emotional distress. All risks, losses and costs associated with investing, including total loss of principal, are your responsibility. The views and opinions expressed in this article are those of the authors and do not necessarily reflect the official policy or position of FXStreet nor its advertisers. The author will not be held responsible for information that is found at the end of links posted on this page.
If not otherwise explicitly mentioned in the body of the article, at the time of writing, the author has no position in any stock mentioned in this article and no business relationship with any company mentioned. The author has not received compensation for writing this article, other than from FXStreet.
FXStreet and the author do not provide personalized recommendations. The author makes no representations as to the accuracy, completeness, or suitability of this information. FXStreet and the author will not be liable for any errors, omissions or any losses, injuries or damages arising from this information and its display or use. Errors and omissions excepted.
The author and FXStreet are not registered investment advisors and nothing in this article is intended to be investment advice.
Recommended Content
Editors’ Picks
EUR/USD holds above 1.0700 after US data

EUR/USD struggles to build on Wednesday's gains and fluctuates in a tight channel near 1.0700 on Thursday. The data from the US showed that weekly Jobless Claims held steady at 208,000, helping the USD hold its ground and limiting the pair's upside.
GBP/USD fluctuates above 1.2500 following Wednesday's rebound

GBP/USD stays in a consolidation phase slightly above 1.2500 on Thursday after closing in the green on Wednesday. A mixed market mood caps the GBP/USD upside after Unit Labor Costs and weekly Jobless Claims data from the US.
Gold retreats to $2,300 despite falling US yields

Gold stays under bearish pressure and trades deep in negative territory at around $2,300 on Thursday. The benchmark 10-year US Treasury bond edges lower following the Fed's policy decisions but XAU/USD struggles to find a foothold.
Top 3 Price Prediction BTC, ETH, XRP: Altcoins to pump once BTC bottoms out, slow grind up for now

Bitcoin reclaiming above $59,200 would hint that BTC has already bottomed out, setting the tone for a run north. Ethereum holding above $2,900 keeps a bullish reversal pattern viable despite falling momentum. Ripple coils up for a move north as XRP bulls defend $0.5000.
Happy Apple day

Apple is due to report Q1 results today after the bell. Expectations are soft given that Apple’s Chinese business got a major hit in Q1 as competitors increased their market share against the giant Apple.