EUR/USD Current Price: 1.1114
View Live Chart for the EUR/USD
The week started in slow motion across the forex board, with the American dollar benefiting partially from a strong risk appetite that underpins worldwide stocks. The absence of macroeconomic releases during the upcoming US session, should see investors turning their eyes to stocks for clues. Early Europe, news surprised towards the upside, as seasonally adjusted Industrial Production in the EU In January 2016, rose by 2.1%, compared to a -1.0% in December. The positive data has prevented the EUR from falling further, in spite of equities' rallies.
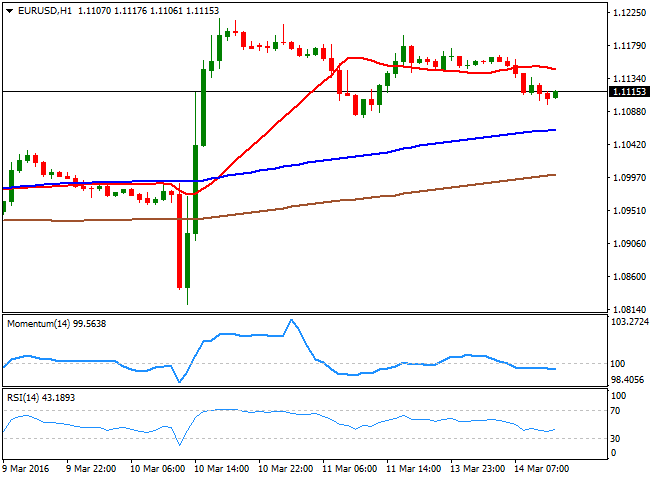
Technically the EUR/USD pair is trading a handful of pips above the 1.1100 figure, with the short term technical picture pointing for some further declines, given that in the 1 hour chart, the pair is below a bearish 20 SMA, while the technical indicators hover directionless within bearish territory. In the 4 hours chart, however, the price remains well above its larger moving averages, whilst the 20 SMA heads strongly higher and provides an immediate support around 1.1090. In this last time frame, the technical indicators are slowly turning higher after correcting overbought readings, in line with the dominant bullish trend.
Support levels: 1.1090 1.1050 1.1010
Resistance levels: 1.1160 1.1200 11240
GBP/USD Current price: 1.4364
View Live Chart for the GBP/USD
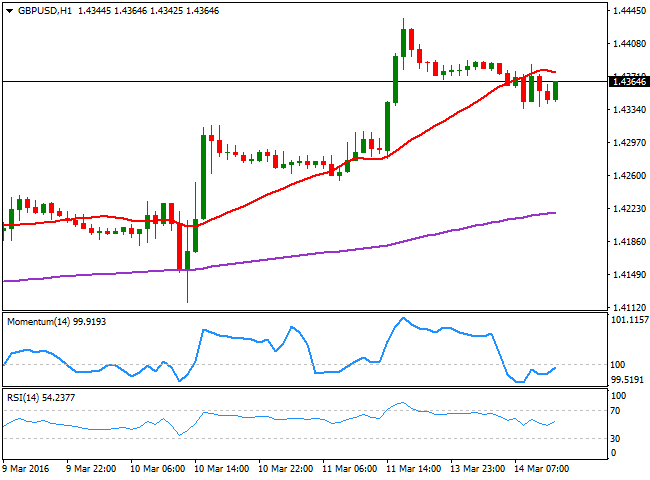
The GBP/USD pair has retraced from the high set last week at 1.4435, mostly consolidating its latest gains and waiting for a trigger. With the dollar broadly lower, the downside seems quite limited and investors will likely take dips as opportunities to buy. The short term technical picture reflects the lack of bearish strength, given that the technical indicators have turned higher below their mid-lines, although in the same chart, the price remains below a horizontal 20 SMA. In the 4 hours chart, the technical picture favors the upside, with the price above a bullish 20 SMA and the technical indicators consolidating near overbought territory. Nevertheless, the pair needs to extend beyond 1.4410 to be able to rally towards the 1.4500 level.
Support levels: 1.4335 1.4295 1.4260
Resistance levels: 1.4410 1.4445 1.4490
USD/JPY Current price: 113.62
View Live Chart for the USD/JPY
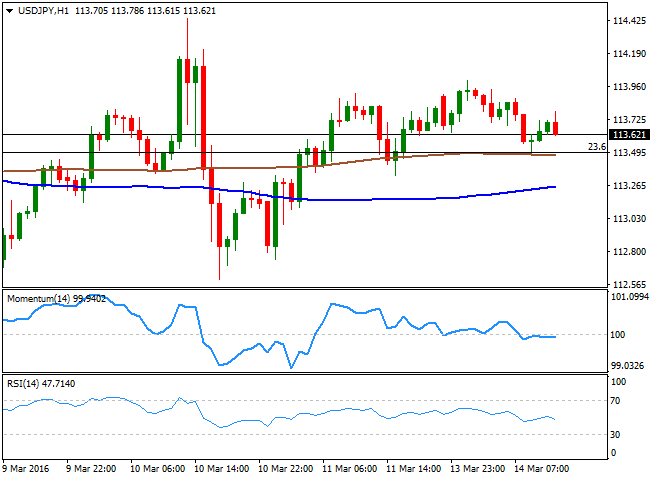
Neutral below 114.00. The USD/JPY pair continues trading within a quite limited range this Monday, unable to retain gains beyond the 114.00 figure. The pair advanced during the Asian session, as the yen weakened alongside with the Nikkei's rally. But the European opening favored dollar's decline. The short term technical picture for the pair shows that the price remains above the 23.6% retracement of its latest decline around 113.50, while the 200 SMA converges with the mentioned Fibonacci level, now the immediate support. The technical indicators present limited bearish slopes within neutral territory, lacking enough strength to confirm a new leg lower for today. In the 4 hours chart, the technical picture is also neutral, with the price hovering between moving averages and the technical indicators stuck around their mid-lines. To confirm a stronger advance, the price needs to extend beyond the 114.60 something quite unlikely for today and ahead of the upcoming FED's meeting next Wednesday.
Support levels: 113.50 113.10 112.70
Resistance levels: 114.00 114.60 115.05
AUD/USD Current price: 0.7541
View Live Chart for the AUD/USD
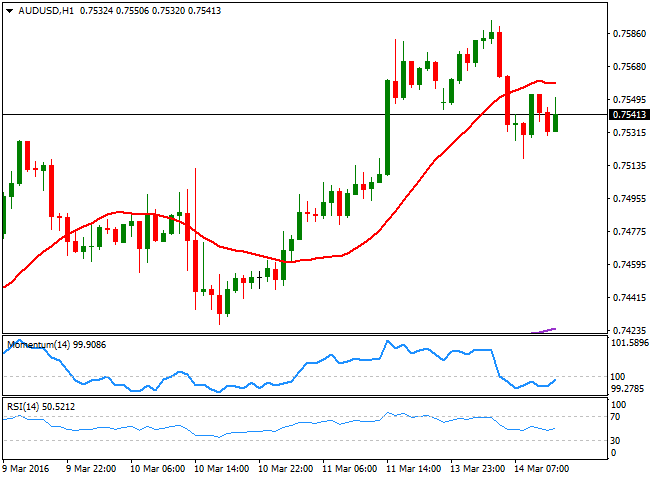
The AUD/USD pair has rallied up to 0.7583 at the beginning of the day, but turned south and fell down to 0.7530 alongside with commodities' prices retreating from their recent highs. The Aussie however, remains among the strongest currencies across the board, and seems unlikely the pair will change direction any time soon. Technically, the 1 hour chart shows that the technical indicators have recovered with bearish territory, but that the price remains below a horizontal 20 SMA, overall with no signs of strengthening further. In the 4 hours chart, the bullish tone prevails given that the price is above a bullish 20 SMA whilst the technical indicators head nowhere, but remain above their mid-lines.
Support levels: 0.7500 .7465 0.7430
Resistance levels: 0.7580 0.7630 0.7665
Information on these pages contains forward-looking statements that involve risks and uncertainties. Markets and instruments profiled on this page are for informational purposes only and should not in any way come across as a recommendation to buy or sell in these assets. You should do your own thorough research before making any investment decisions. FXStreet does not in any way guarantee that this information is free from mistakes, errors, or material misstatements. It also does not guarantee that this information is of a timely nature. Investing in Open Markets involves a great deal of risk, including the loss of all or a portion of your investment, as well as emotional distress. All risks, losses and costs associated with investing, including total loss of principal, are your responsibility. The views and opinions expressed in this article are those of the authors and do not necessarily reflect the official policy or position of FXStreet nor its advertisers. The author will not be held responsible for information that is found at the end of links posted on this page.
If not otherwise explicitly mentioned in the body of the article, at the time of writing, the author has no position in any stock mentioned in this article and no business relationship with any company mentioned. The author has not received compensation for writing this article, other than from FXStreet.
FXStreet and the author do not provide personalized recommendations. The author makes no representations as to the accuracy, completeness, or suitability of this information. FXStreet and the author will not be liable for any errors, omissions or any losses, injuries or damages arising from this information and its display or use. Errors and omissions excepted.
The author and FXStreet are not registered investment advisors and nothing in this article is intended to be investment advice.
Recommended Content
Editors’ Picks
EUR/USD rises toward 1.0800 on USD weakness

EUR/USD trades in positive territory above 1.0750 in the second half of the day on Monday. The US Dollar struggles to find demand as investors reassess the Fed's rate outlook following Friday's disappointing labor market data.
GBP/USD closes in on 1.2600 as risk mood improves

Following Friday's volatile action, GBP/USD pushes higher toward 1.2600 on Monday. Soft April jobs report from the US and the improvement seen in risk mood make it difficult for the US Dollar to gather strength.
Gold gathers bullish momentum, climbs above $2,320

Gold trades decisively higher on the day above $2,320 in the American session. Retreating US Treasury bond yields after weaker-than-expected US employment data and escalating geopolitical tensions help XAU/USD stretch higher.
Addressing the crypto investor dilemma: To invest or not? Premium

Bitcoin price trades around $63,000 with no directional bias. The consolidation has pushed crypto investors into a state of uncertainty. Investors can expect a bullish directional bias above $70,000 and a bearish one below $50,000.
Three fundamentals for the week: Two central bank decisions and one sensitive US Premium

The Reserve Bank of Australia is set to strike a more hawkish tone, reversing its dovish shift. Policymakers at the Bank of England may open the door to a rate cut in June.


