EUR/USD Current price: 1.0580
View Live Chart for the EUR/USD
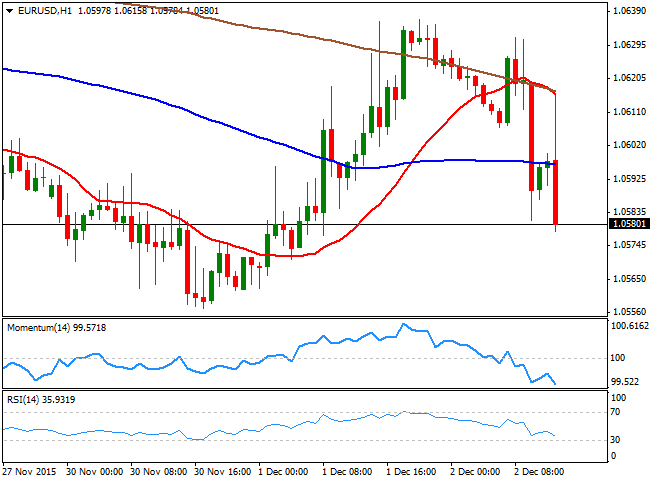
The common currency plummeted to a daily low of 1.0577 against the greenback after the release of the EU inflation figures, which showed another decrease in the core annual reading, down to 0.9% from previous 1.1%. Basically, the poor inflation reading is an incentive for the ECB to extend its facilities this Thursday. Ahead of Wall Street opening, the US released its ADP private survey, which showed that the economy added 217K new jobs in November against 190K expected. The EUR/USD pair jumped up to 1.0615 right after the release but quickly resumed its decline, presenting a strong bearish short term tone in the 1 hour chart, as the technical indicators head sharply lower below their mid-lines, whilst the price is accelerating below its moving averages. In the 4 hours chart, the price moves back and forth around a horizontal 20 SMA, while the technical indicators head slightly lower around their mid-lines. increasing the risk of a downward continuation on a break below 1.0550, the immediate support.
Support levels: 1.0550 1.0520 1.0490
Resistance levels: 1.0610 1.0650 1.0690
GBP/USD Current price: 1.5004
View Live Chart for the GPB/USD
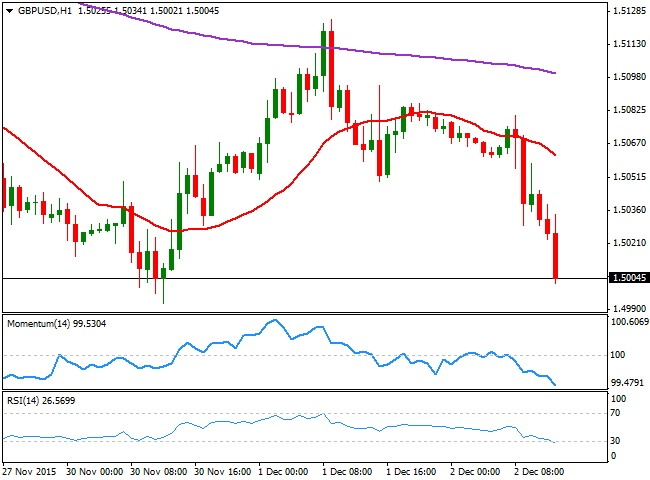
The GBP/USD pair was trading lower, but fell down to 1.5018 after the release of the UK Construction PMI, down to 55.3 in November against previous 58.8 and expectations of 58.2. Lately, the UK data has been surprising towards the downside, fueling speculation that the BOE will have to delay a rate hike beyond the first half of 2016. A better than expected US ADP survey pushed the pair even lower, now challenging the 1.5000 psychological figure, and with a strong short term downward momentum according to the 1 hour chart, as the technical indicators head sharply lower in oversold territory, whilst the price develops well below a bearish 20 SMA. In the 4 hours chart, the technical indicators are crossing their mid-lines towards the downside, whilst the price extends below an also bearish 20 SMA, supporting the ongoing bearish tone.
Support levels: 1.5000 1.4960 1.4920
Resistance levels: 1.5020 1.5050 1.5090
USD/JPY Current price: 123.32
View Live Chart for the USD/JPY
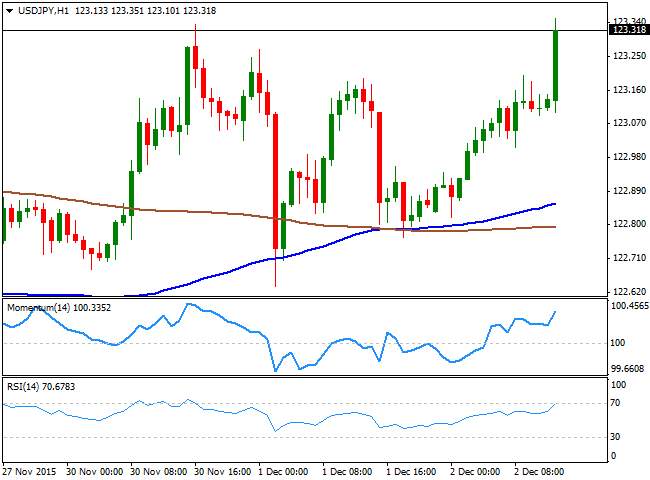
Bullish on US data. The USD/JPY pair advanced to its highest this week, reaching 123.35 on the back of strong US employment data, as the ADP survey showed that the private sector added 217K new jobs during November, beating expectations of a 190K advance. The pair holds to its gains ahead of the US opening, and the 1 hour chart shows that the price is well above its 100 and 200 SMAs, whilst the technical indicators have resumed their advances and head sharply higher near overbought territory, all of which favors additional gains on a break above 123.40, the immediate resistance. In the 4 hours chart, the technical outlook is also bullish, as the technical indicators extend their bounce further into positive territory.
Support levels: 122.60 122.20 121.70
Resistance levels: 123.40 123.75 124.40
AUD/USD Current price: 0.7311
View Live Chart for the AUD/USD
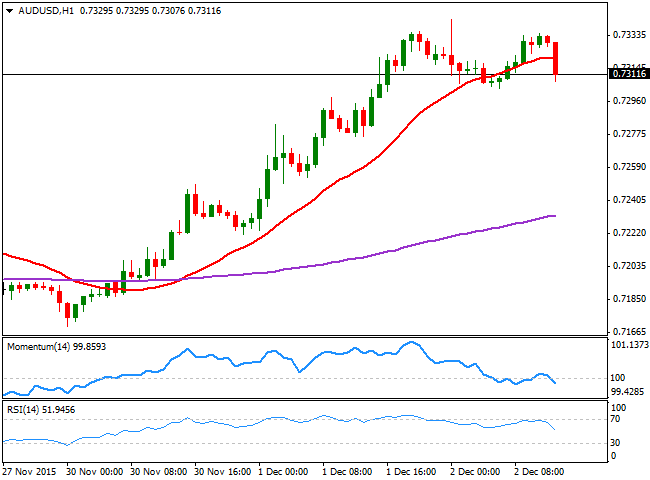
The AUD/USD pair is easing some on dollar's demand, but overall holding to its latest strength, trading above the 0.7300 level. During the Asian session, Australia released its GDP data for the third quarter, up to 0.9% from a previously revised 0.3% and expectations of 0.8%. The short term picture is mild bearish, as the price is breaking below its 20 SMA and the technical indicators are heading lower around their mid-lines, although a clear break below the 0.7300 figure is required to confirm a bearish movement. In the 4 hours chart, the technical indicators are getting exhausted in overbought territory, barely suggesting a downward correction at the time being.
Support levels: 0.7280 0.7240 0.7200
Resistance levels: 0.7335 0.7380 0.7410
Information on these pages contains forward-looking statements that involve risks and uncertainties. Markets and instruments profiled on this page are for informational purposes only and should not in any way come across as a recommendation to buy or sell in these assets. You should do your own thorough research before making any investment decisions. FXStreet does not in any way guarantee that this information is free from mistakes, errors, or material misstatements. It also does not guarantee that this information is of a timely nature. Investing in Open Markets involves a great deal of risk, including the loss of all or a portion of your investment, as well as emotional distress. All risks, losses and costs associated with investing, including total loss of principal, are your responsibility. The views and opinions expressed in this article are those of the authors and do not necessarily reflect the official policy or position of FXStreet nor its advertisers. The author will not be held responsible for information that is found at the end of links posted on this page.
If not otherwise explicitly mentioned in the body of the article, at the time of writing, the author has no position in any stock mentioned in this article and no business relationship with any company mentioned. The author has not received compensation for writing this article, other than from FXStreet.
FXStreet and the author do not provide personalized recommendations. The author makes no representations as to the accuracy, completeness, or suitability of this information. FXStreet and the author will not be liable for any errors, omissions or any losses, injuries or damages arising from this information and its display or use. Errors and omissions excepted.
The author and FXStreet are not registered investment advisors and nothing in this article is intended to be investment advice.
Recommended Content
Editors’ Picks
AUD/USD regains the constructive outlook above the 200-day SMA

AUD/USD advanced strongly for the second session in a row, this time extending the recovery to the upper 0.6500s and shifting its focus to the weekly highs in the 0.6580-0.6585 band, an area coincident with the 100-day SMA.
EUR/USD keeps the bullish performance above 1.0700

The continuation of the sell-off in the Greenback in the wake of the FOMC gathering helped EUR/USD extend its bounce off Wednesday’s lows near 1.0650, advancing past the 1.0700 hurdle ahead of the crucial release of US NFP on Friday.
Gold stuck around $2,300 as market players lack directional conviction

Gold extended its daily slide and dropped below $2,290 in the second half of the day on Thursday. The benchmark 10-year US Treasury bond yield erased its daily losses after US data, causing XAU/USD to stretch lower ahead of Friday's US jobs data.
Bitcoin price rises 5% as BlackRock anticipates a new wave of capital inflows into BTC ETFs from investors

Bitcoin (BTC) price slid to the depths of $56,552 on Wednesday as the cryptocurrency market tried to front run the Federal Open Market Committee (FOMC) meeting. The flash crash saw millions in positions get liquidated.
FOMC in the rear-view mirror – NFP eyed

The update from May’s FOMC rate announcement proved more dovish than expected, which naturally weighed on the US dollar (sending the DXY to lows of 105.44) and US yields, as well as, initially at least, underpinning major US equity indices.


