EUR/USD Current price: 1.0685
View Live Chart for the EUR/USD
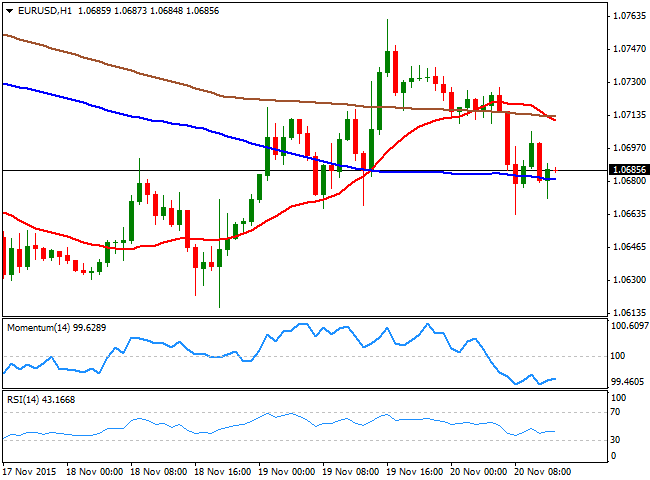
The common currency gave back a good chunk of its Thursday's gains against the greenback, on the back of ECB's Draghi comments on economic policy, earlier today. Draghi addressed the European Banking Congress in Frankfurt, saying that the ECB monetary policy measures have worked, but given the slack growth momentum and that inflation remains below the 2.0% target, the Central Bank is ready to take more action. His usual rhetoric on a probable December extension of QE, sent the EUR/USD pair down to 1.0663, with former bounces meeting selling interest around the 1.0700 figure. The US calendar will lack macroeconomic releases, although Bullard and Dudley from the FED are scheduled to speak sometime during the American afternoon.From a technical point of view, the long term picture remains clearly bearish, with the pair having set a lower low weekly basis. Despite the lack of follow through, the upside remains well limited on the wake of the latest Draghi's words. In the short term, the 1 hour chart shows that the price has fell below its 20 and 200 SMAs, both around 1.0710, while the technical indicators are well below their mid-lines, without bearish strength but far from supporting an upward move. In the 4 hours chart, the price continues seesawing around a horizontal 20 SMA, while the Momentum indicator has turned lower, right above its 100 level, and the RSI hovers directionless around 47, leaving little room for a steeper recovery.
Support levels: 1.0630 1.0585 1.0550
Resistance levels: 1.0710 1.0750 1.0790
GBP/USD Current price: 1.5241
View Live Chart for the GPB/USD
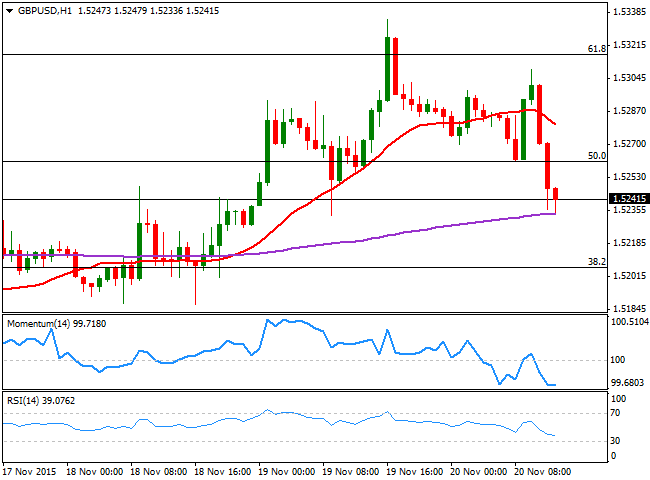
The British Pound traded generally higher in the European morning, advancing up to 1.5309 after the release of the UK Money figures. According to the latest release, public sector net borrowing decreased to £54.3 billion from a year before, but the GBP/USD pair reverted its intraday gains after meeting selling interest in the 1.5300 region, and trades at its daily low ahead of the US opening. The 1 hour chart shows that the price is now well below a mild bearish 20 SMA, whilst the technical indicators head south near oversold territory, increasing the bearish potential for the upcoming hours. In the 4 hours chart, the price is now challenging a bullish 20 SMA, whilst the technical indicators have turned south and are about to cross their mid-lines towards the downside, in line with the shorter term outlook.
Support levels: 1.5210 1.5175 1.5130
Resistance levels: 1.5265 1.5320 1.5355
USD/JPY Current price: 122.82
View Live Chart for the USD/JPY
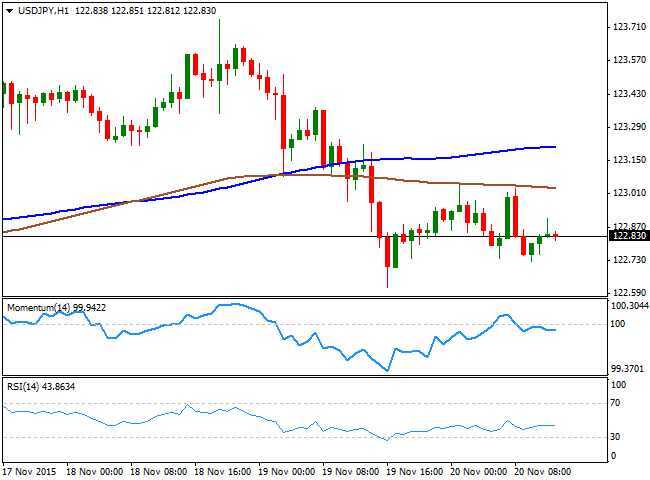
More slides below 122.60. The USD/JPY pair held near its recent lows, consolidating below the 123.00 level for most of this Friday. The Japanese yen strengthened further after the latest BOJ meeting, as officers somehow are convincing investors that an extension in QE is for now, out of the table. The short term picture has turned bearish, as in the 1 hour chart, the pair has been unable to advance beyond its 200 SMA, currently the immediate resistance around 123.00. In the same chart the technical indicators present mild bearish slopes below their mid-lines, favoring additional declines despite the lack of bearish strength. In the 4 hours chart, the prices remains well above their moving averages but the technical indicators are slowly turning south in negative territory, supporting a bearish move, particularly on a break below 122.60, the immediate support.
Support levels: 122.60 122.20 121.70
Resistance levels: 123.05 123.40 123.75
AUD/USD Current price: 0.7213
View Live Chart for the AUD/USD
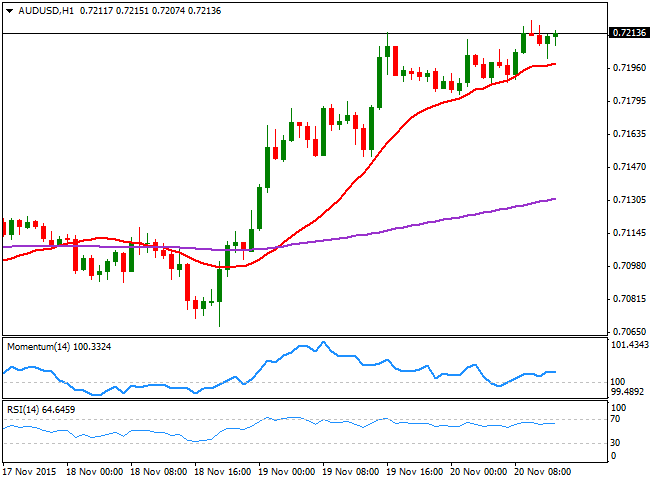
The Australian dollar trades above the 0.7200 level against the greenback, with the pair at its highest in two weeks, boosted by an improved risk sentiment. The Aussie has been enjoying of some demand after the release of much better-than-expected employment data released earlier today, and by a more confident central bank, as the RBA continues to give signs of being satisfied with the ongoing economic developments. The 1 hour chart shows that the price is advancing above its 20 SMA, which attracted buyers on intraday dips, whilst the technical indicators hold above their mid-lines. In the 4 hours chart, the price advanced further above its 200 EMA, while the technical indicators have lost their upward strength and hold near overbought levels, far from suggesting the rally is over.
Support levels: 0.7195 0.7150 0.7110
Resistance levels: 0.7240 0.7285 0.7330
Information on these pages contains forward-looking statements that involve risks and uncertainties. Markets and instruments profiled on this page are for informational purposes only and should not in any way come across as a recommendation to buy or sell in these assets. You should do your own thorough research before making any investment decisions. FXStreet does not in any way guarantee that this information is free from mistakes, errors, or material misstatements. It also does not guarantee that this information is of a timely nature. Investing in Open Markets involves a great deal of risk, including the loss of all or a portion of your investment, as well as emotional distress. All risks, losses and costs associated with investing, including total loss of principal, are your responsibility. The views and opinions expressed in this article are those of the authors and do not necessarily reflect the official policy or position of FXStreet nor its advertisers. The author will not be held responsible for information that is found at the end of links posted on this page.
If not otherwise explicitly mentioned in the body of the article, at the time of writing, the author has no position in any stock mentioned in this article and no business relationship with any company mentioned. The author has not received compensation for writing this article, other than from FXStreet.
FXStreet and the author do not provide personalized recommendations. The author makes no representations as to the accuracy, completeness, or suitability of this information. FXStreet and the author will not be liable for any errors, omissions or any losses, injuries or damages arising from this information and its display or use. Errors and omissions excepted.
The author and FXStreet are not registered investment advisors and nothing in this article is intended to be investment advice.
Recommended Content
Editors’ Picks
AUD/USD: Uptrend remains capped by 0.6650

AUD/USD could not sustain the multi-session march north and faltered once again ahead of the 0.6650 region on the back of the strong rebound in the Greenback and the prevailing risk-off mood.
EUR/USD meets a tough barrier around 1.0800

The resurgence of the bid bias in the Greenback weighed on the risk-linked assets and motivated EUR/USD to retreat to the 1.0750 region after another failed attempt to retest the 1.0800 zone.
Gold eases toward $2,310 amid a better market mood

After falling to $2,310 in the early European session, Gold recovered to the $2,310 area in the second half of the day. The benchmark 10-year US Treasury bond yield stays in negative territory below 4.5% and helps XAU/USD find support.
Bitcoin price coils up for 20% climb, Standard Chartered forecasts more gains for BTC

Bitcoin (BTC) price remains devoid of directional bias, trading sideways as part of a horizontal chop. However, this may be short-lived as BTC price action consolidates in a bullish reversal pattern on the one-day time frame.
What does stagflation mean for commodity prices?

What a difference a quarter makes. The Federal Reserve rang in 2024 with a bout of optimism that inflation was coming down to their 2% target. But that optimism has now evaporated as the reality of stickier-than-expected inflation becomes more evident.
