EUR/USD Current price: 1.1376
View Live Chart for the EUR/USD

The American dollar is broadly lower against all of its major rivals, but the Pound, as commodities and stocks soared with the European opening. The FED Minutes of the latest meeting released late Thursday, were seen as quite dovish, and despite several members saw a rate hike before the end of the year, the fact is that it also expressed their concerns over a weaker dollar and global turmoil. Also, the meeting was held before the latest awful payroll figures, which now add to speculation the FED won't be ready for a lift off until March next year. As for today's data, there were no relevant releases in Europe, whilst in the US attention is focused on upcoming speeches from FED members.
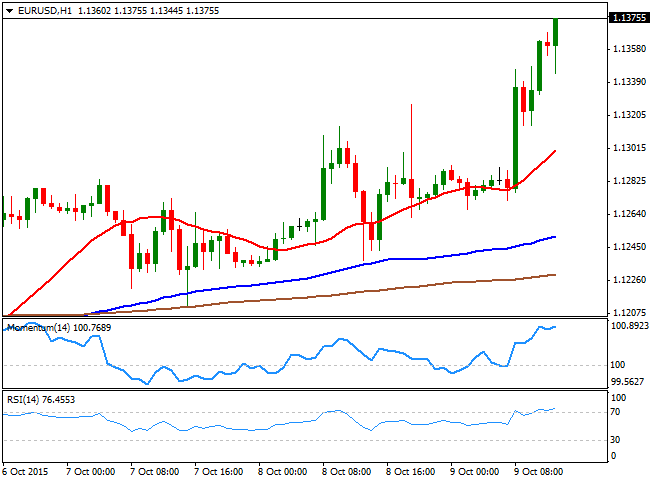
Technically, the EUR/USD pair presents a strong bullish tone, with the price at its highest in 3-weeks, reaching fresh weekly highs above the 1.1370 level ahead of the US opening. The 1 hour chart shows that the technical indicators are retreating some, but are still in extreme overbought levels, whilst the 20 SMA has accelerated strongly above the 100 and 200 SMAs. In the 4 hours chart, the price is above a bullish 20 SMA, whilst the technical indicators have lost their upward strength near overbought territory, far from signaling a downward corrective movement ahead.
Support levels: 1.1335 1.1295 1.1260
Resistance levels: 1.1425 1.1460 1.1500
GBP/USD Current price: 1.5341
View Live Chart for the GPB/USD
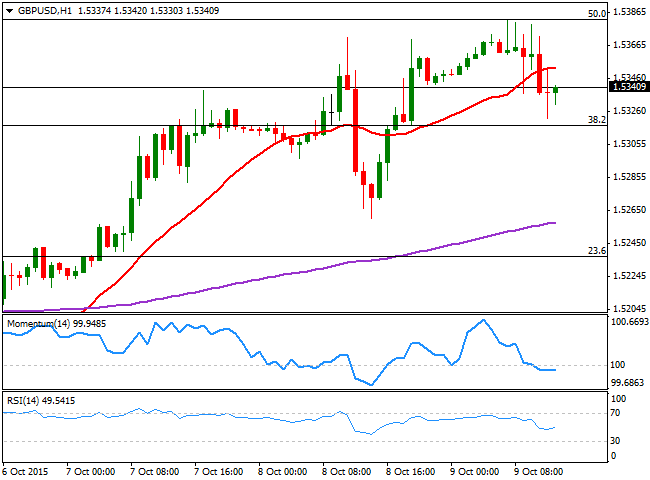
The GBP/USD pair retreated from a fresh weekly high of 1.5382, following the release of the UK trade balance for August, well below expected, as the deficit in goods trade balance resulted at £-11.149B, while the total trade balance came out at £-3.27B against previous £-3.37B. The pair however, is now recovering from a session low of 1.5321, and the 1 hour chart shows that the technical indicators have erased all of their extreme overbought readings, while trying to recover around their mid-lines. In the 4 hours chart, the price is holding above its 20 SMA and 200 EMA, maintaining the risk towards the downside, whilst the technical indicators lack now directional strength above their mid-lines.
Support levels: 1.5315 1.5260 1.5220
Resistance levels: 1.5385 1.5430 1.5480
USD/JPY Current price: 120.22
View Live Chart for the USD/JPY
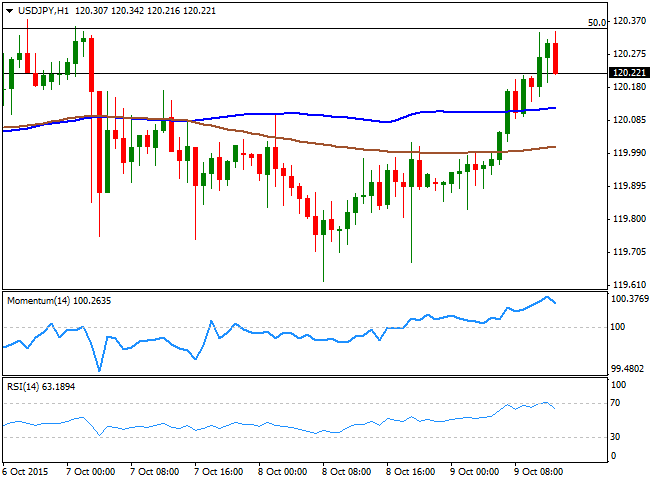
Still directionless, but above 120.00. Risk appetite has helped the USD/JPY advance up to 120.34, but broad dollar's strength is preventing the pair from advancing further, despite the sharp advance in worldwide stocks. The pair retreated some from the mentioned high, meeting once again intraday selling interest around the a strong Fibonacci level, the 50% retracement of the latest weekly decline. Technically, the 1 hour chart shows that the price is above its 100 and 200 SMAs that anyway are horizontal, whist the technical indicators are turning lower near overbought levels. In the 4 hours chart, the Momentum indicator aims higher above its 100 level, whilst the RSI lacks directional strength around 53. The pair needs to advance beyond the 120.70 to be able to gain additional upward momentum, with the next strong resistance at 121.35, the top of these last months' range.
Support levels: 119.60 119.35 118.90
Resistance levels: 120.35 120.70 121.00
AUD/USD Current price: 0.7338
View Live Chart for the AUD/USD
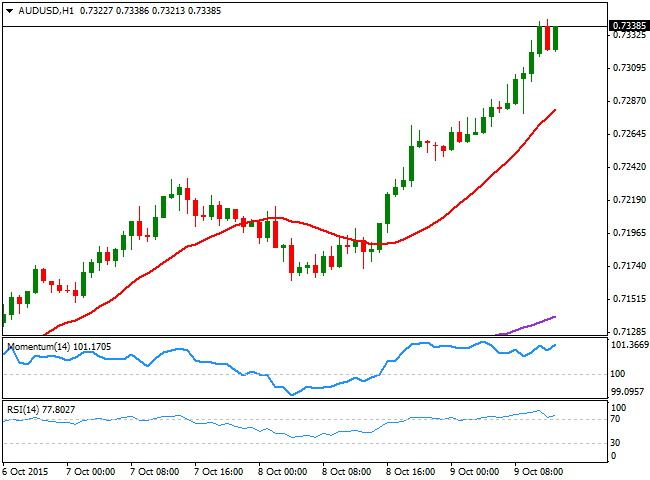
The AUD/USD pair surged to a fresh 2-month high of 0.7343, trading a few pips below it ahead of the US opening, supported by dollar's sell-off an a strong upward momentum in gold prices, as spot trades well above the 1,150 level. The Aussie has a strong upward momentum against its American rival, and the 1 hour chart shows that the rally may extend over the upcoming hours, as the technical indicators are heading higher in overbought territory, after a limited downward corrective move, whilst the price has accelerated well above a bullish 20 SMA. In the 4 hours chart, the technical indicators are losing their upward strength but hold in overbought territory.
Support levels: 0.7320 0.7275 0.7240
Resistance levels: 0.7365 0.7400 0.7440
Information on these pages contains forward-looking statements that involve risks and uncertainties. Markets and instruments profiled on this page are for informational purposes only and should not in any way come across as a recommendation to buy or sell in these assets. You should do your own thorough research before making any investment decisions. FXStreet does not in any way guarantee that this information is free from mistakes, errors, or material misstatements. It also does not guarantee that this information is of a timely nature. Investing in Open Markets involves a great deal of risk, including the loss of all or a portion of your investment, as well as emotional distress. All risks, losses and costs associated with investing, including total loss of principal, are your responsibility. The views and opinions expressed in this article are those of the authors and do not necessarily reflect the official policy or position of FXStreet nor its advertisers. The author will not be held responsible for information that is found at the end of links posted on this page.
If not otherwise explicitly mentioned in the body of the article, at the time of writing, the author has no position in any stock mentioned in this article and no business relationship with any company mentioned. The author has not received compensation for writing this article, other than from FXStreet.
FXStreet and the author do not provide personalized recommendations. The author makes no representations as to the accuracy, completeness, or suitability of this information. FXStreet and the author will not be liable for any errors, omissions or any losses, injuries or damages arising from this information and its display or use. Errors and omissions excepted.
The author and FXStreet are not registered investment advisors and nothing in this article is intended to be investment advice.
Recommended Content
Editors’ Picks
AUD/USD regains the constructive outlook above the 200-day SMA

AUD/USD advanced strongly for the second session in a row, this time extending the recovery to the upper 0.6500s and shifting its focus to the weekly highs in the 0.6580-0.6585 band, an area coincident with the 100-day SMA.
EUR/USD keeps the bullish performance above 1.0700

The continuation of the sell-off in the Greenback in the wake of the FOMC gathering helped EUR/USD extend its bounce off Wednesday’s lows near 1.0650, advancing past the 1.0700 hurdle ahead of the crucial release of US NFP on Friday.
Gold stuck around $2,300 as market players lack directional conviction

Gold extended its daily slide and dropped below $2,290 in the second half of the day on Thursday. The benchmark 10-year US Treasury bond yield erased its daily losses after US data, causing XAU/USD to stretch lower ahead of Friday's US jobs data.
Bitcoin price rises 5% as BlackRock anticipates a new wave of capital inflows into BTC ETFs from investors

Bitcoin (BTC) price slid to the depths of $56,552 on Wednesday as the cryptocurrency market tried to front run the Federal Open Market Committee (FOMC) meeting. The flash crash saw millions in positions get liquidated.
FOMC in the rear-view mirror – NFP eyed

The update from May’s FOMC rate announcement proved more dovish than expected, which naturally weighed on the US dollar (sending the DXY to lows of 105.44) and US yields, as well as, initially at least, underpinning major US equity indices.